Sometimes I ride the Internet over the funny, creepy, tiny Forex retail world. It’s often hilarious when we, true profitable traders, see some trading systems with huge profit (+2000% per year) and huge drawdowns (-70%). This is the kind of system we see the most on the specialized Forex website and the most “followed” too. A lot of investors only see the final return per year and don’t even take care of the drawdown. Until this kind of “investors” lose money. Losing money is always a rich experience teaching you the good way to take. This kind of system can be detected really easily except for dumb investors and traders.
But there is one thing the rookie “investor” can have trouble to notice until he will learn what is it exactly : the equity curve of trading system.
Yes. There is another curve different from the growing account curve. I know, it’s surprising. In fact, this curve is as important as the return curve because it explains how the trader is managing the risk over the long run.
This equity curve is calculated by the money available on a trading account at a given moment. The growth curve is easy to understand : this is the amount of money on your account. More you have, more you are rich. However, it’s not because you have $1000000 on your trading account that you can withdraw $1000000. If you have trades running on the Market, you freeze the dedicated money relating to your leverage and lot size. For example, if you have 2 trades running with 5% risk for each (which is crazy risk), you have “only” $900000 available on your account until your trades are closed. 2 x 5% risk = 10% risk. 10% of $1000000 = $100000. Money available : $1000000-$100000 = $900000. In fact, it’s even less than that because of your margin level.
So, the equity curve represents the money commited on the Forex market at a given moment. By analyzing it for a particular trading system, you can see how many money is at risk during accurate periods of time. Of course, if the equity curve reaches the deadly 0 level, you have lost all your money.
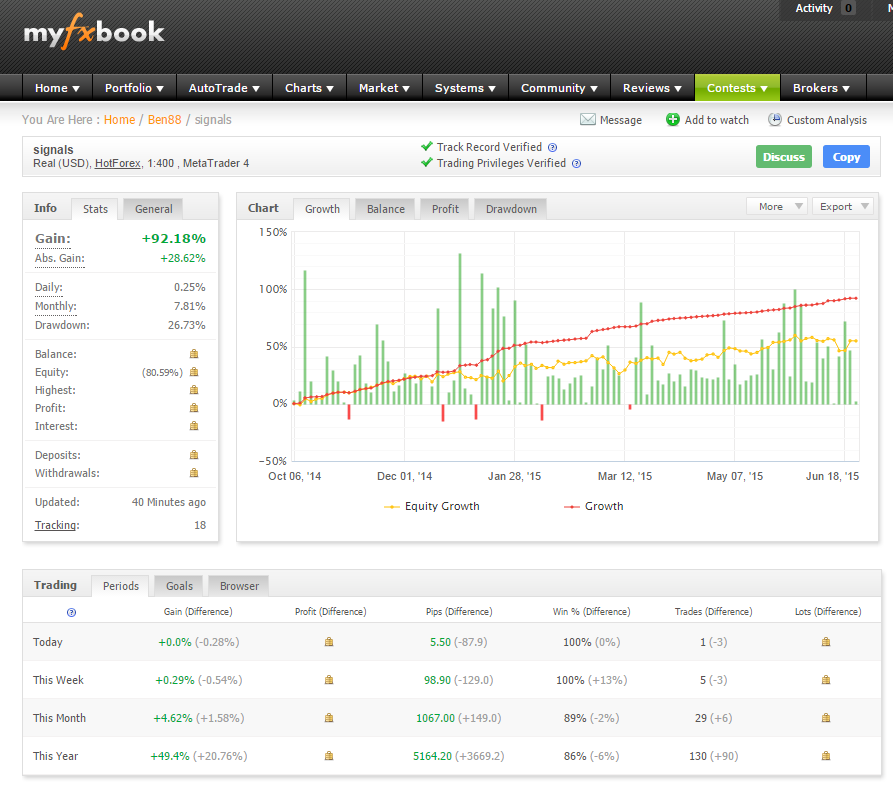
The things become funny when the growth curve and the equity curve are no more friends and take their own path to live their own life. It’s not a good idea at all. I took a random example on the famous Myfxbook website :
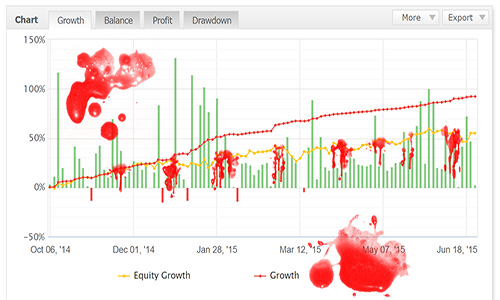
Something wrong ? The same with color painting :
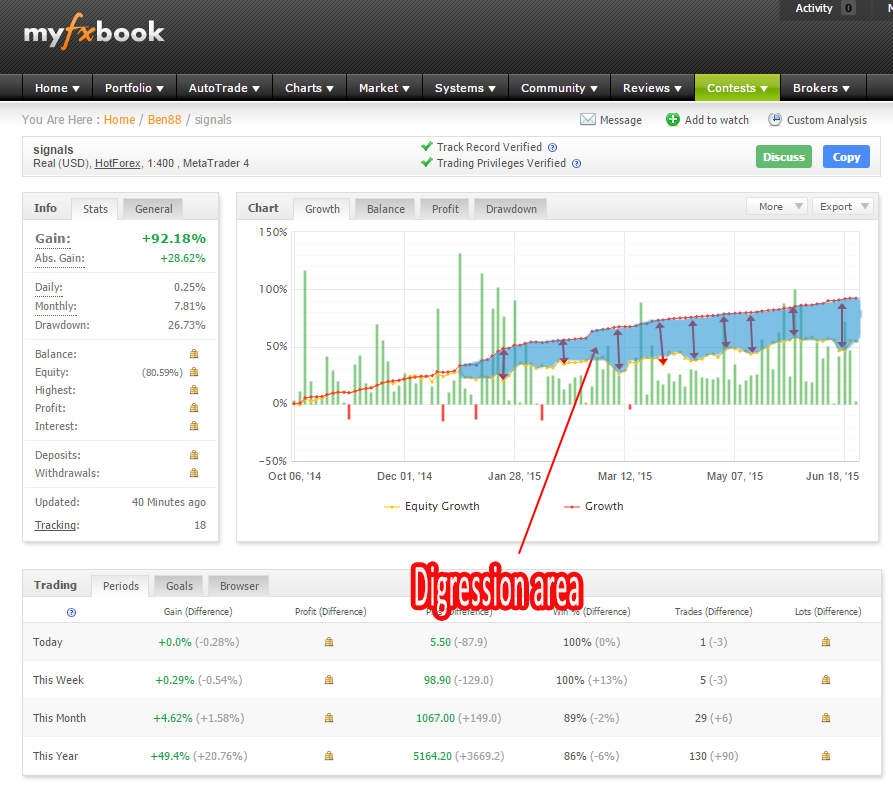
Above, you can see that currently the growth is at 92% and the equity around 56%. What does that mean ? In fact, the “trader” is currently exposing 36% (92-56) on the Market. If you only look at the growth and the historic drawdown (26%), you can think that the system could be good to use. However, what do you think about a money management which exposes 36% (more than a third of your account!) of your money at a given time and even since 6 months. Of course, it’s a creepy system and we will see when the equity curve will reach the funny 0 level for a nice margin call.
In this particular case, we can have 2 main hypothesis:
- This guy doesn’t use stoploss and has a running position since few months. If it’s the case, the margin call is a matter of time. Not using stoploss on Forex Market is like throwing your money down the drain.
- This “trader” uses stoploss but have a bunch of running positions with too heavy risk implied. Having 36% of its own capital at risk since few months is dangerous. Even, just for one single day, it’s crazy. Imagine taking only 3 trades exposing each one 30% of your account. Surprise, these are all wrong. Account blew up.
When you assess a trading system, don’t forget to look at the equity curve. It’s critical because it provides you the way the trader manages the risk on the market. Now, if you go to some signal provider sites you can have a lot of fun. The famous site Myfxbook launched a signal provider platform few weeks ago, called “signalstart.com”. We can see this kind of system on it :
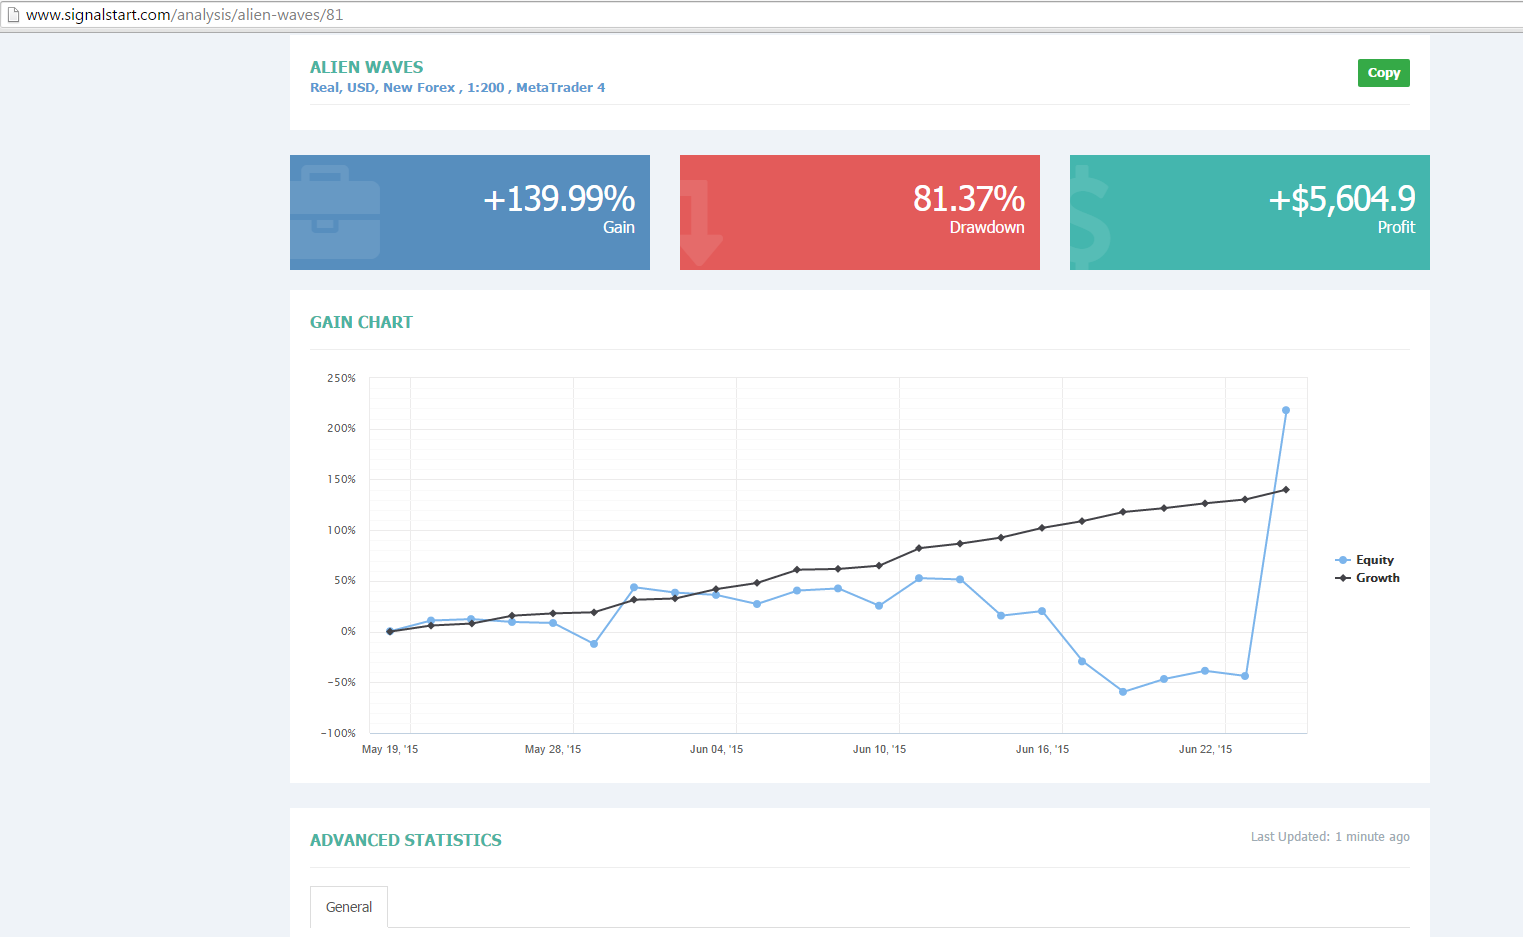
“Alien waves” is aptly named. It’s obvious that the money management is some kind of alien for this “trader”. How it’s possible to expose 80% of its own capital at a given moment. It’s pure crazyness. The proper picture may be that :
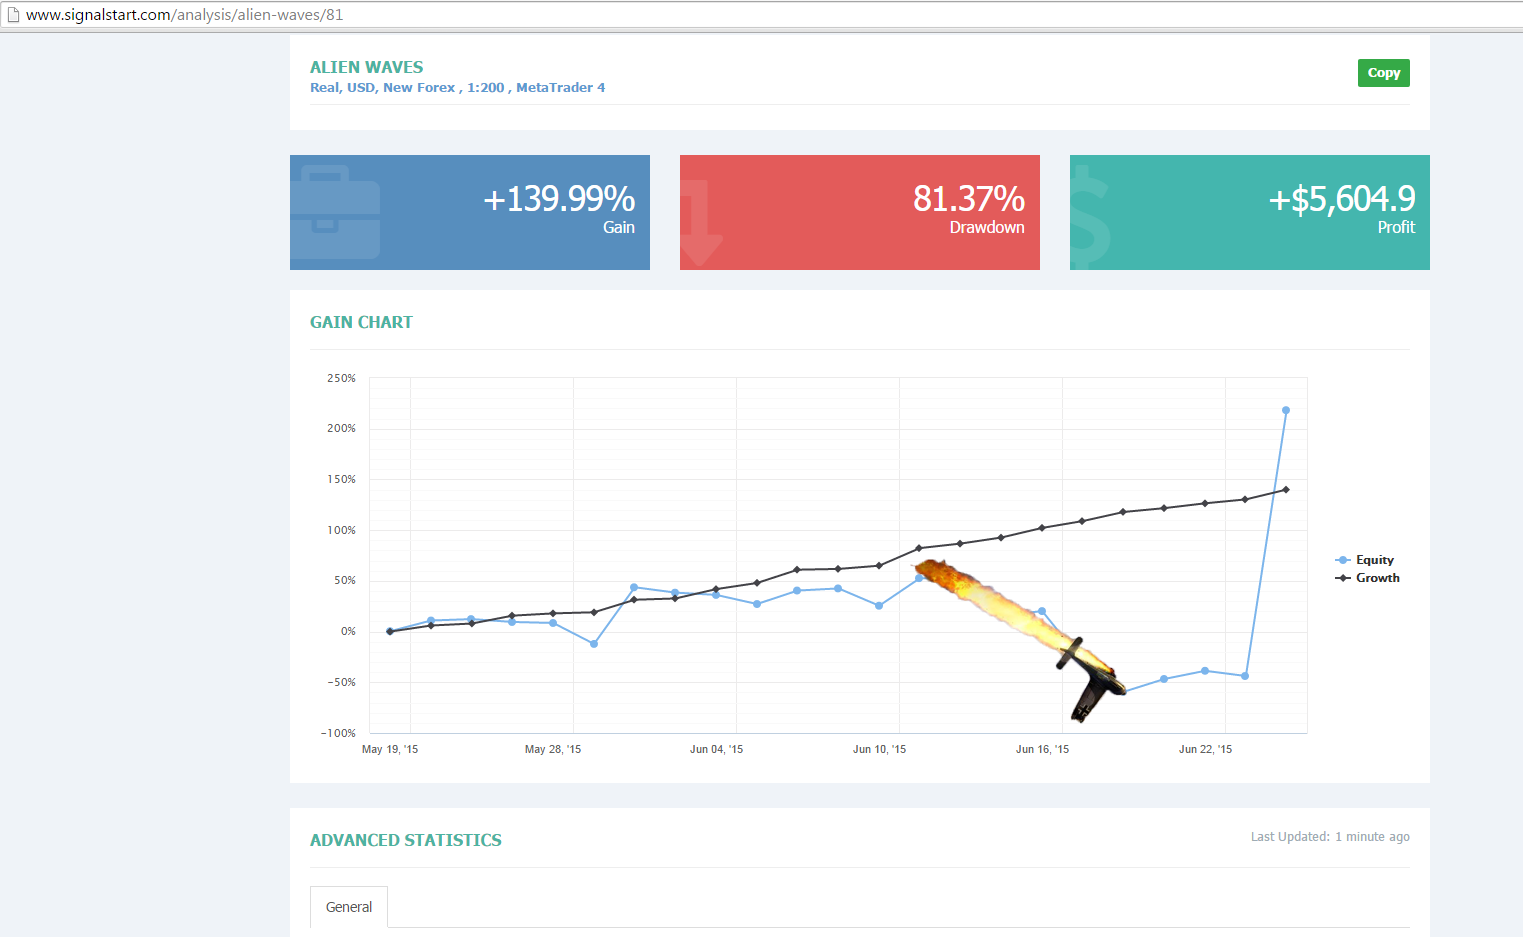
This system is really lucky because it came really near to the margin call with a cute 81% drawdown and after the equity became higher than the current account. I don’t know why but I bet that this alien has a really short life expectancy. Time will say.
Another funny system called “Strategy that works” :
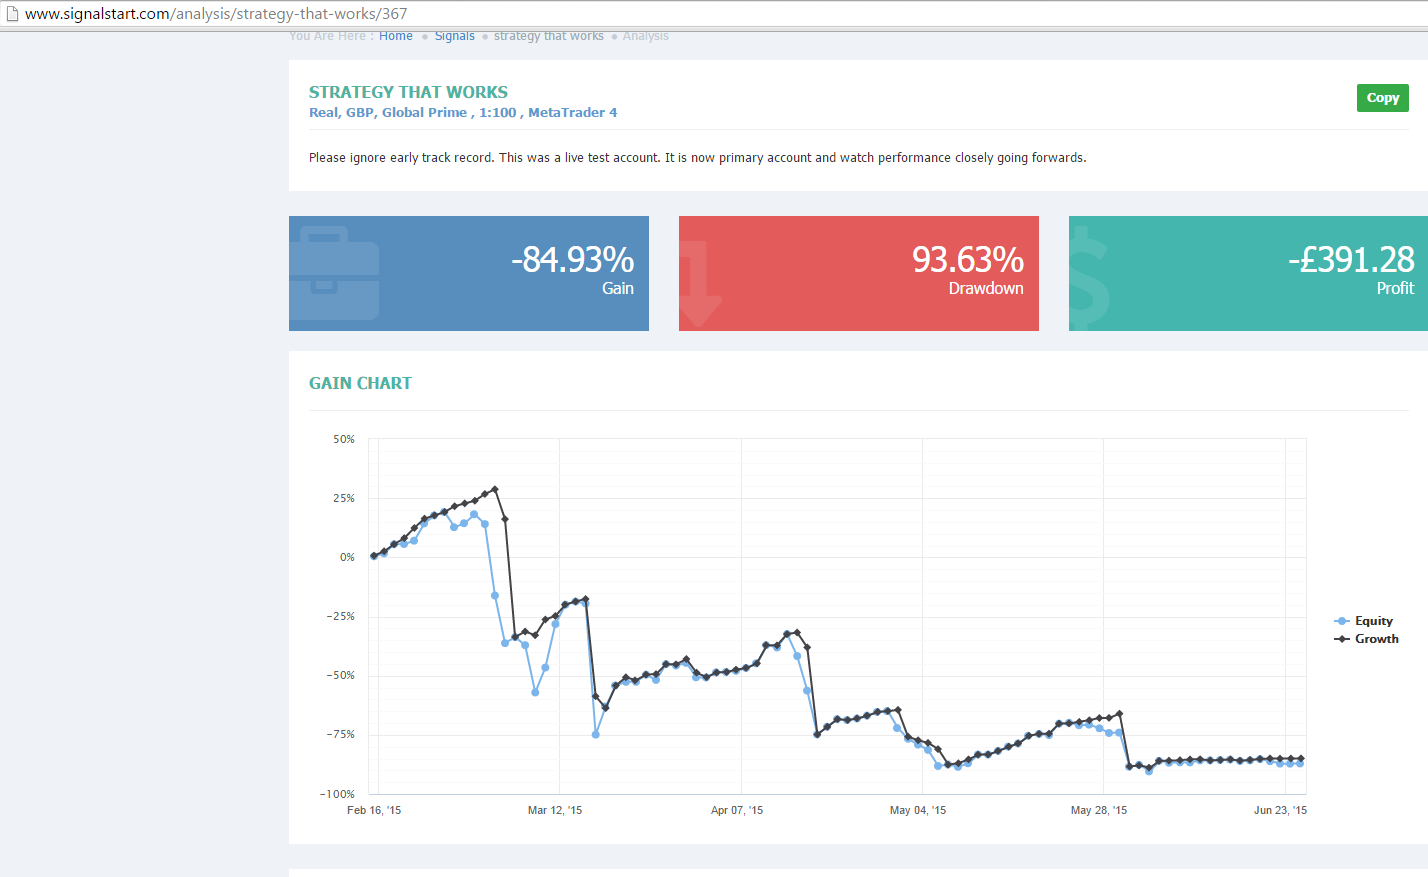
93% Drawdown ? Okay… why not. But in that case, what can we call a Strategy that doesn’t work ?
All of these examples are caricatural (but sadly true) because if you let a child trade, the results would be almost the same. Now, we could analyze the risk management of this kind of system :
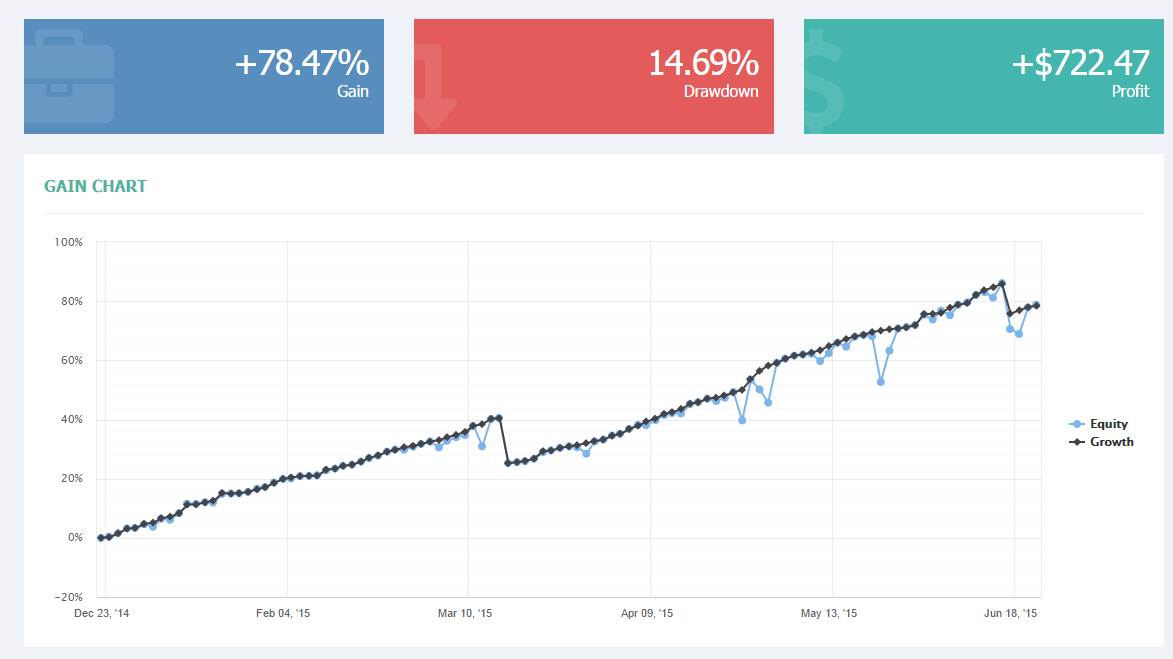
In this case, the risk is harder to reveal but still there… We can see the May 26, the trader exposed almost 20% of its capital in one day. It’s huge. Hopefully, the equity curve rejoined the growth curve to make a kiss but the scenario could have been different. You can expect big coming drawdowns with this kind of system.
On the Forex, you have to always expect the worst. Just remind the January 15th…
When you analyze the reliability of a trading system, don’t forget to look closely at the equity curve !
Some trading websites don’t even display this information or partially, like www.share4you.com or www.mql5.com. If you go to these kind of sites and want to invest in some strategies, my advice : Take to your heels.
The equity curve and the growth curve have to be friend forever. They have to follow each other over the long run. If the equity curve falls apart and the growth curve keeps increasing, it’s a really bad sign for your money.
Great post! Thanks for the information. I am following you closely to see how things to develop.
Hi,
Old (yet useful) article. But regarding mql5 You should update the information. There is Equity curve (Balance or DD related) on that site on signal providers.
Regards,
Alex
Hi,
Yes, you’re right. This Grid/Martingale nest is showing the Balance and the Equity on the same graph
Thanks