
Since I remembered that I had a website, I wanted to share an indicator with my single and unique visitor in order to thank him to place great hopes on me to publish a new article browsing this ugly and empty website every single day… That’s so touching… Thanks my dear little Google bot !
In fact, that’s pretty strange because I’m supposed to be a “Naked trader”. “Naked” because I trade without any indicators (not because I trade in brief). So using an indicator on my charts is not expected. However, this indicator is not an oscillator derivated from the Price Action, it’s the Price Action itself shifted in the time. Dear little Google bot, if you read my previous article about the timing, you know that I like to play with the time in order to multiply the opportunities on my charts and find more reliable setups.
It’s a pretty dumb indicator because it’s just drawing Price Action by shifting the time period. However, it can be useful if you want to see the Price Action differently, from different perspectives. Instead of looking for only one pattern at a given time on a given location, you can see the price reacting in a more accurate way than usual.
I had this idea when I was standing on my toilet to hang a clock, then I bumped my head and the flux… No… I’m wrong… I had this dumb idea when I was using different MT4 candles closing time in order to have more setups with only 1 pair. I used the standard NY closing time and the midnight EST closing time. So I decided to do it automatically with an indicator by shifting the time in real-time on my charts.
I’m convinced that the time is an underated component for a lot of trader. We are a lot to look at the levels with attention, to analyze the movement of the Price relating to its value (the Y-axis) but I think the X-axis, the date, the hour, the time is as important as the Price value.
Some traders can argue that the closing time is very important because every traders use the NY closing time and that’s why it’s the only relevant closing time. However, as pure technical traders we can’t forget the first and main principle of the technical analysis :
Everything is in the charts.
The Price is the same everywhere on the charts, no matter the candle closing time. Period.
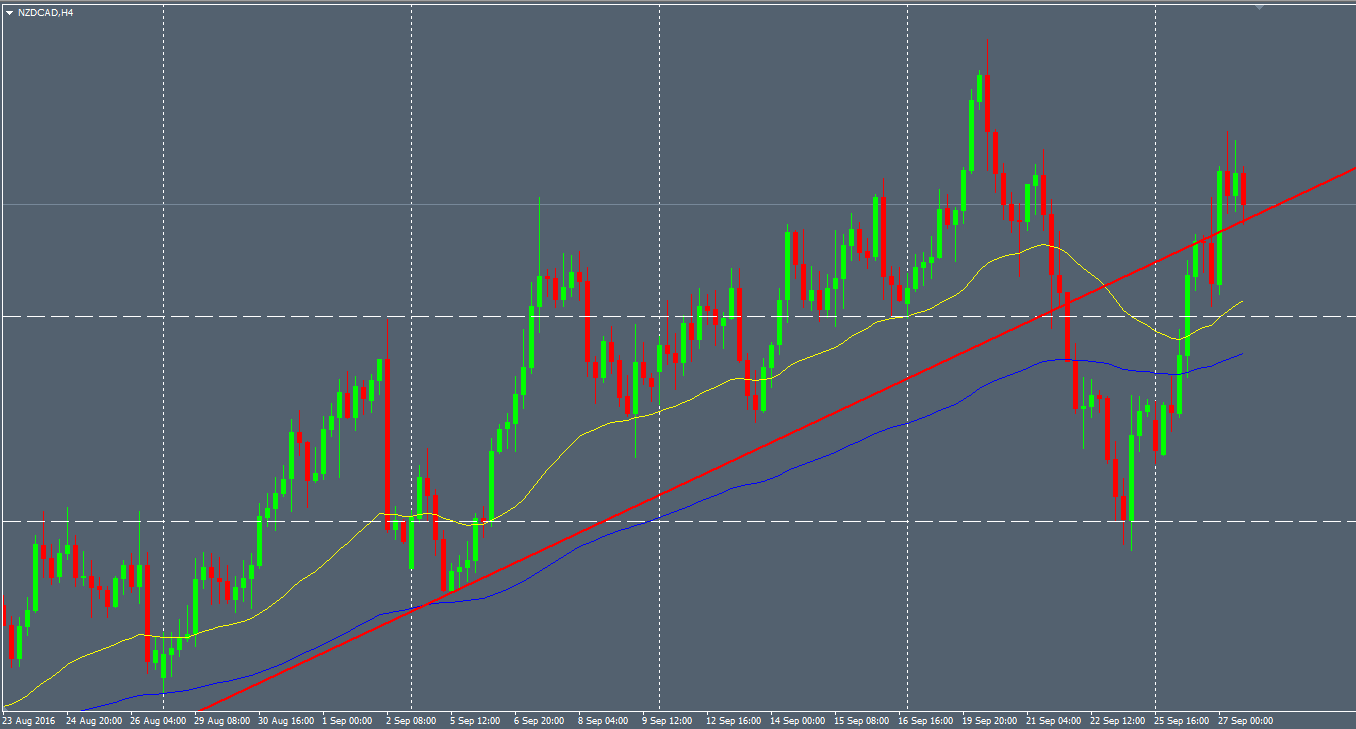
To be more concrete, here’s an example with a SELL H4-based trade on the NZDCAD I took several weeks ago. I was paying attention to this level because the NZDCAD was almost at its historical higher rate. I was looking for selling it in this area. However, no reliable pattern printed on my standard NY closing time chart :
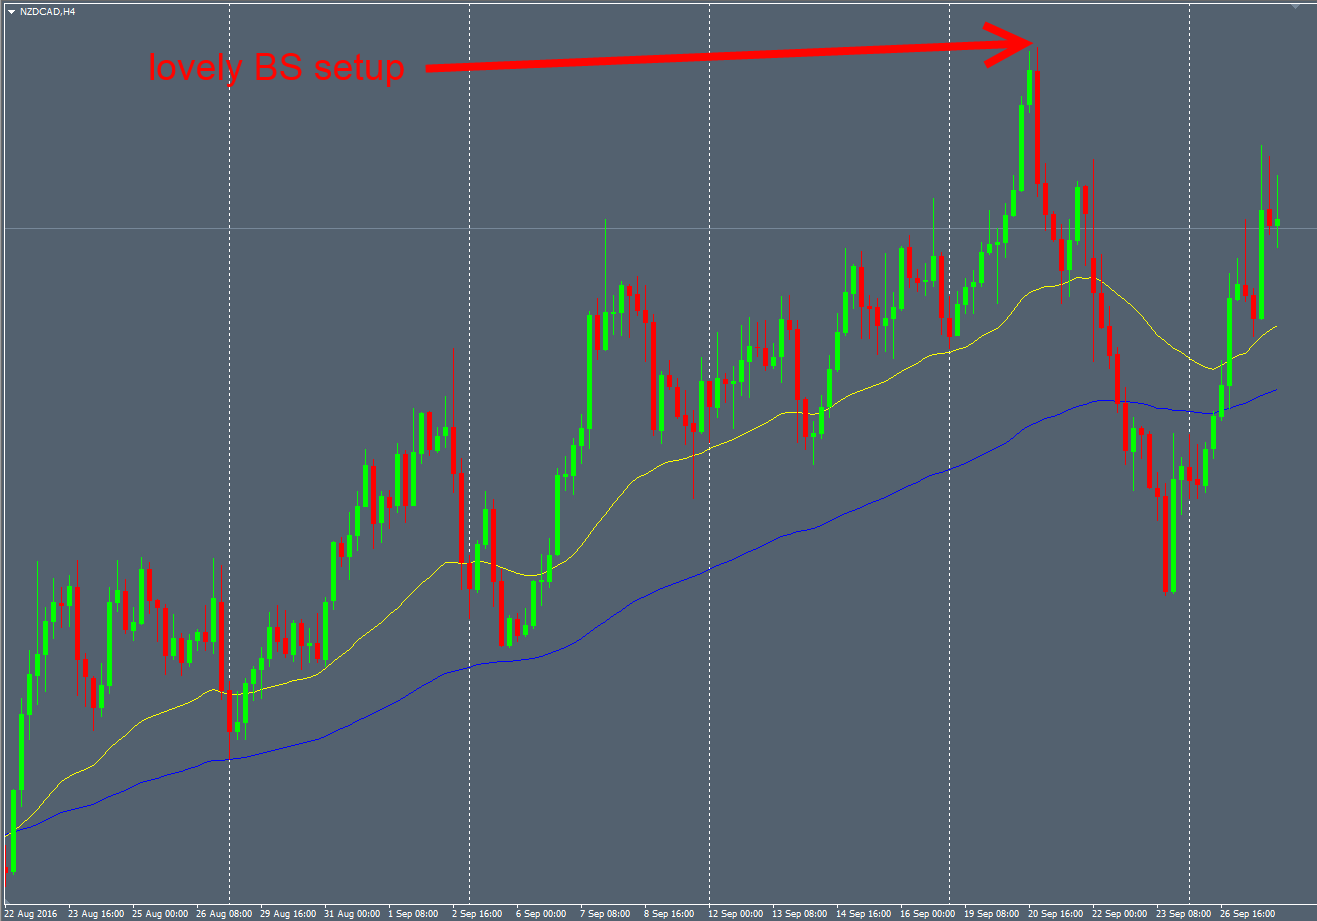
I was so sad… I was depressed to see nothing on this lovely level. I took few antidepressants and had the idea to use the weird indicator I wrote… And the pattern appeared as if by magic :
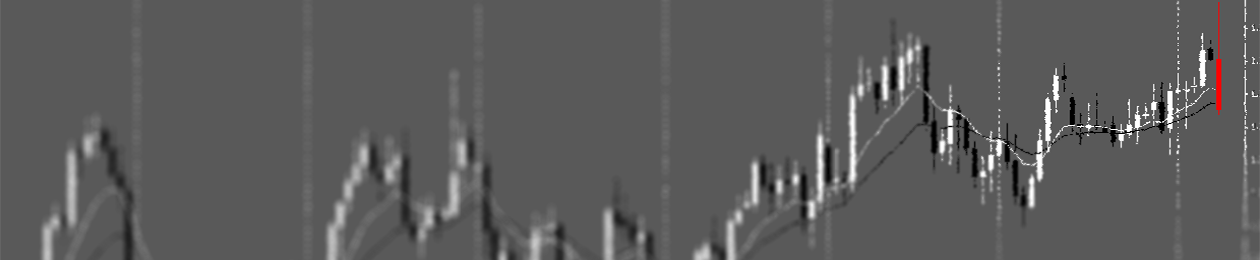
Here is the same chart in motion and twerking thanks to this indicator:
This indicator allows to shift the time on H4 and D1 timeframe. The indicator shifts the time based on the H1 timeframe so the H4 charts will refresh 4 times to show 4 shifts. The D1 timeframe will refresh 24 times to show 24 shifts.
Here’s another example on the EURCAD H4 chart :
You can define your personal refresh rate if you want by customizing the H4 or D1 delay in milliseconds. In a default configuration, the indicator refreshs H4 every second (1000 millisecondes) and the D1 every 400 milliseconds (because there are 24 refresh…).
To use it, you need to put your current chart in “line chart” mode. After that you click right on your chart and you select “properties”. Then, in the “colors” tab, you select the “none” color for the “line charts” box.
Finally, you drag&drop the “Dynamic_Price_Action” indicator. You can customize the color of your candle as you want (the default settings are my default chart colors). Only H4 and D1 timeframes are supported.
You can download this “indicator” here (bugs included for free) : http://s000.tinyupload.com/?file_id=60117540697081890715
If this indicator doesn’t work for you, if you find it useless, if you think this post is useless or even this whole website, feel free to insult me by email. I’ll read this carefully as I have plenty of time.
Hi
I have been testing using the 1H for Daily Trades to get a ‘feel’ for the market but have not ‘nailed’ it yet.
So, I was interested in your approach and would like to try the indicator … the site you link to takes me to a signup page for ‘fun donkey’ ???
Also, while I am here, where can I follow you for a signal service …. do you do that now?
Hi Graeme,
I’ll send you an email with the information