
Guessing the location on the chart where the price action will reverse or will keep on course is the heart activity of the trader. In the previous sections, we saw how to determine the significant S/R levels and which price patterns are reliable enough to use in a heavy trading system. It is easy. With time and experience, the robust S/R levels will be discovered in few seconds and reliable price patterns will become obvious to spot.
However, predicting the place on the chart that will see the price action reverse is another job. The technical difficulty is here.
As we want only the real high-probability setups, I mean at least 0.7 probability of success, foreseeing the hotspot is the critical task to achieve. But it’s not so hard and the backtesting of the Forex market is really helpful.
Previously, we saw different price action properties, the importance of the S/R levels and the reliable price patterns. Here, we will merge the 2 previous trading rules : trade only the pinbar and engulfing bar on the significant S/R levels. By doing it, you will make money on the forex market over the time. It’s pretty easy and 80-90% systematic composed system. However, you will not make a lot of money if not gambling over the time depending on your psychological biais. Again, we have to inject some discretionary items and tips in our trading system to maximize the profits and extract the potential of each opportunities.
First, I want to show that taking only pinbars and engulfing bars on significant S/R levels is profitable. We will see the optmizations after. Here is a sample of the trades I took the last month (March 2015, you can check it on myfxbook page):
AUDNZD Daily engulfing bar SELL trade

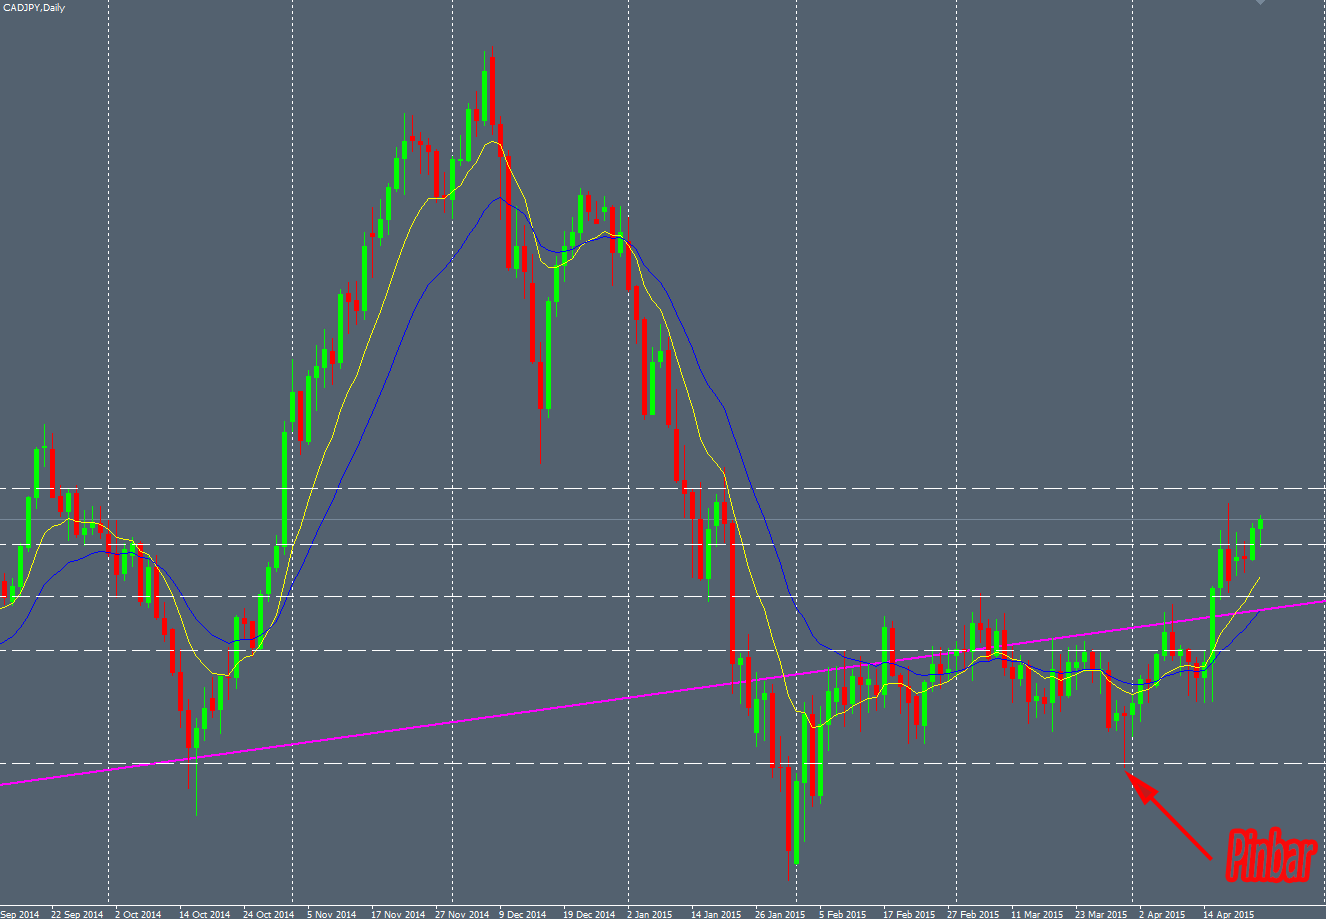
CADJPY Daily pinbar BUY trade
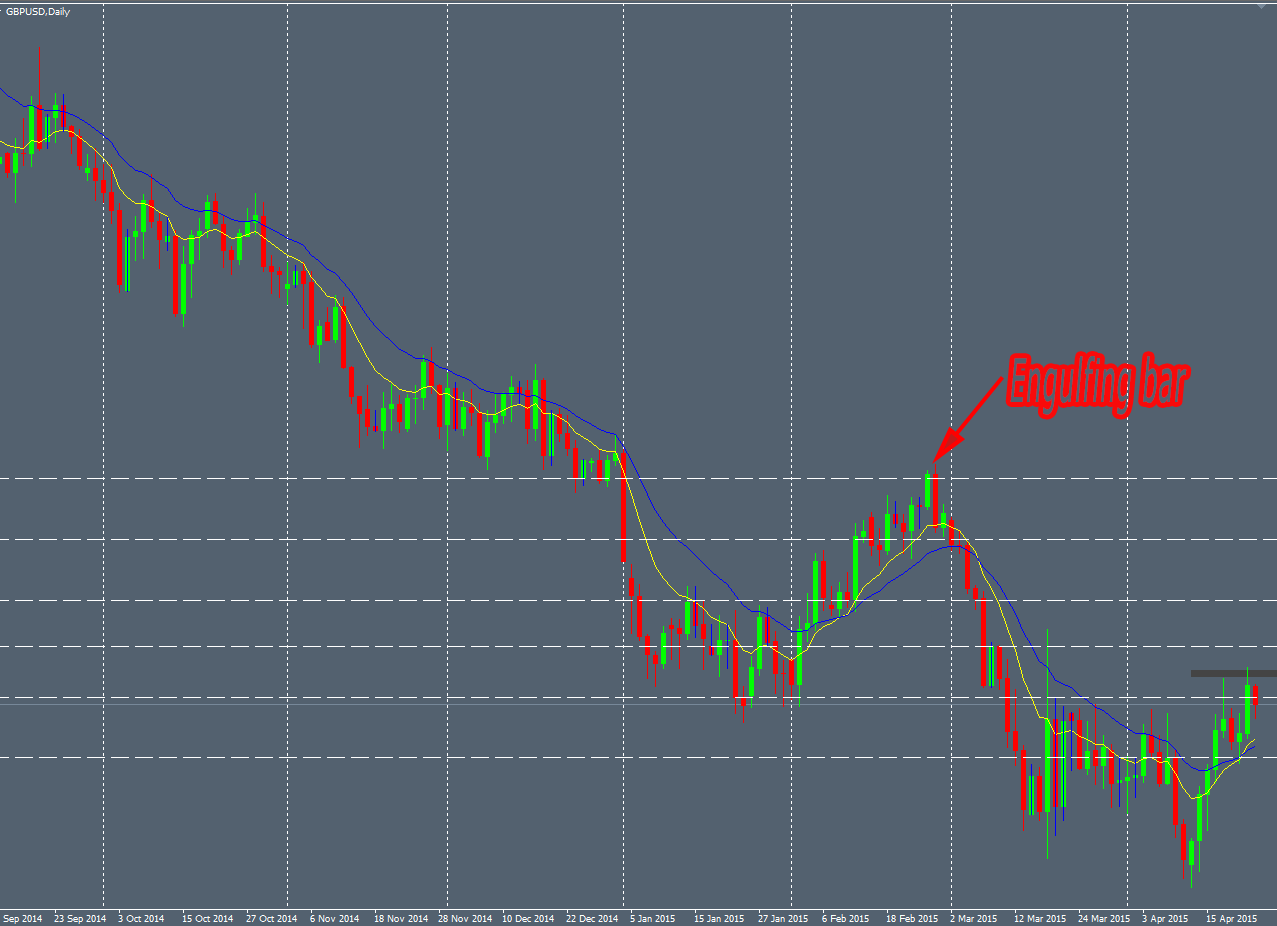
 GBPUSD Daily engulfing bar SELL trade
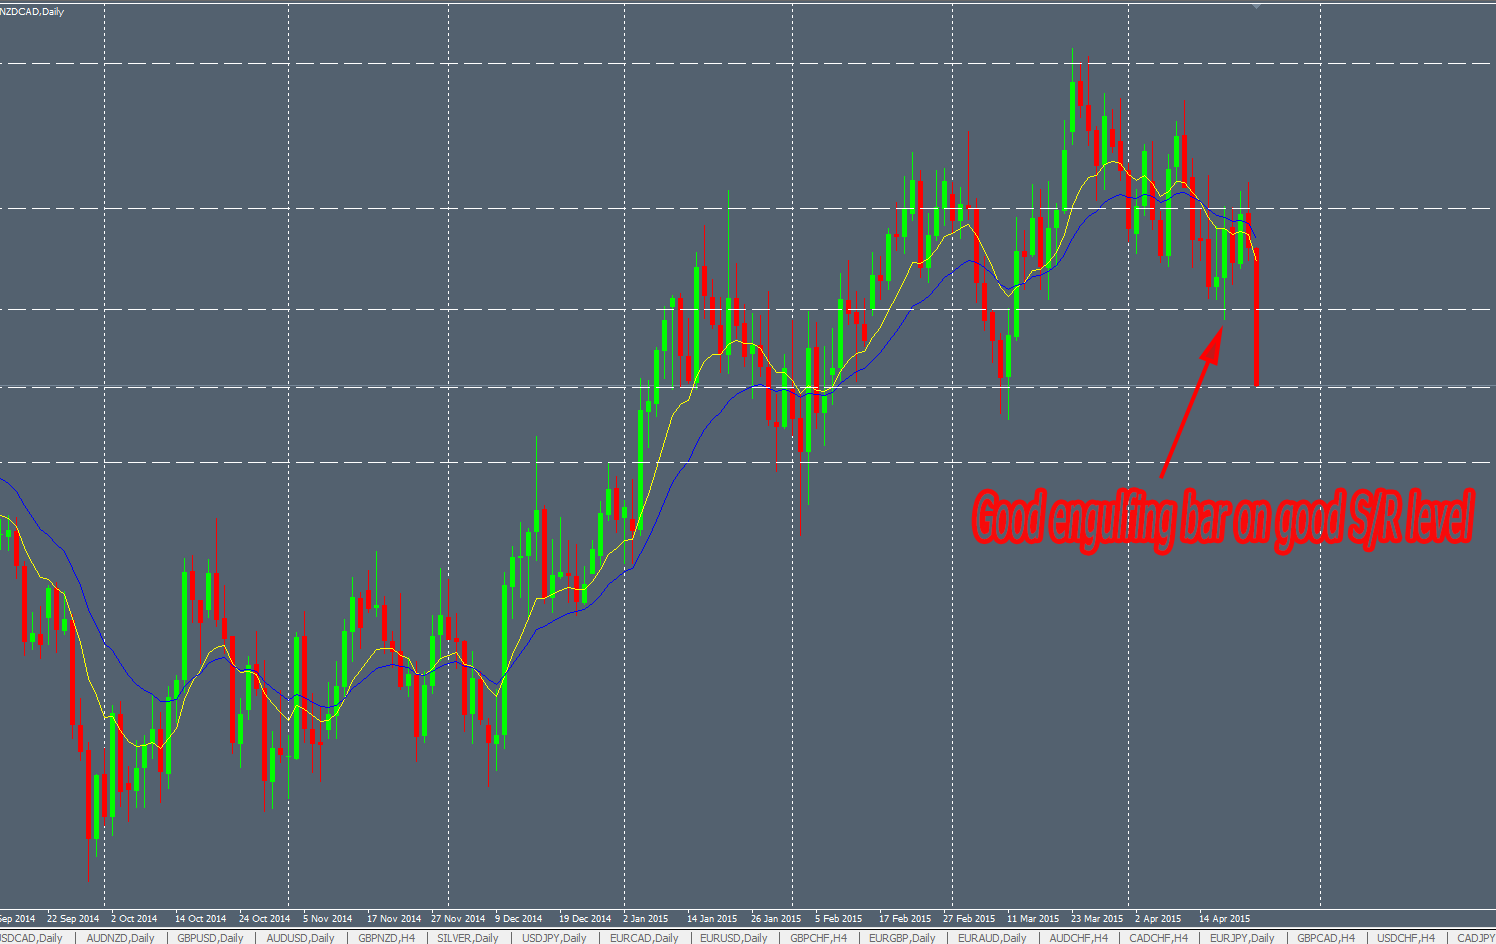
NZDCAD Daily pinbar SELL trade

NZDUSD H4 pinbar SELL trade
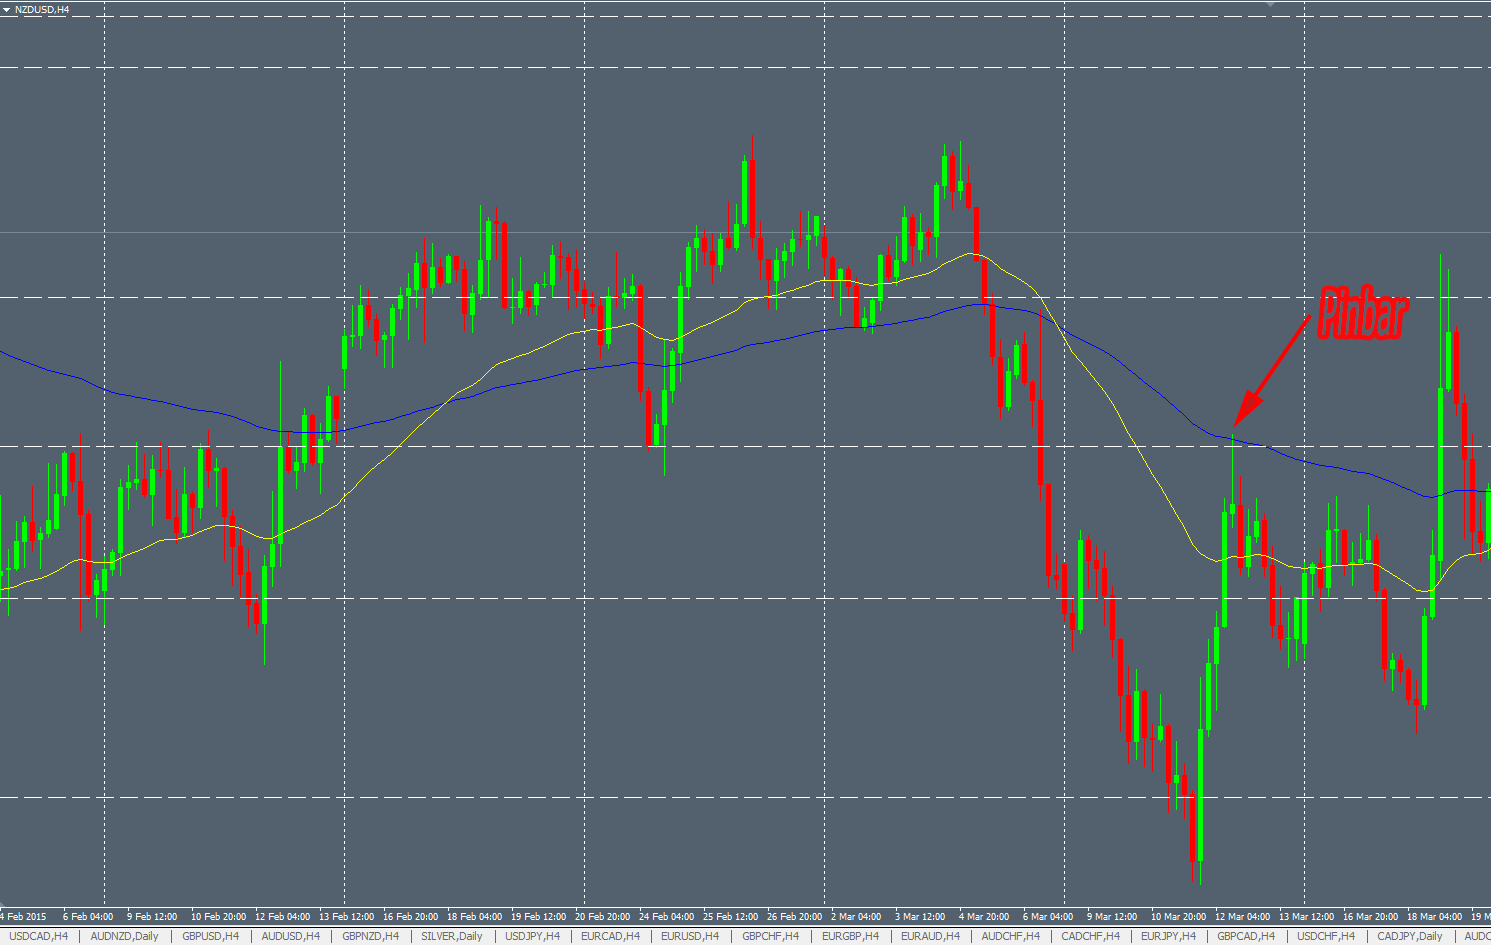
The white horizontal lines are the significant S/R levels on the charts. I draw them as explained here. By finding the confluence points on daily and weekly charts, you can spot them instantaneously with little experience. If you go checking my Myfxbook stats, you’ll see that luckily I didn’t lose any trade during March 2015. 7 trades, 7 winners. Good monthly winratio : 100%. This is pure luck because my annual winratio is around 70-80%. However, it’s interesting to see the strength of this “heavy” system relying on high-probability setups.
But what I don’t tell you here is that there were another setups like that on the charts during the same period of time. Other pinbars and engulfing bars on significant S/R levels were losers. Here is a sample of these losing trades :
AUDUSD Daily pin bar BUY loser trade

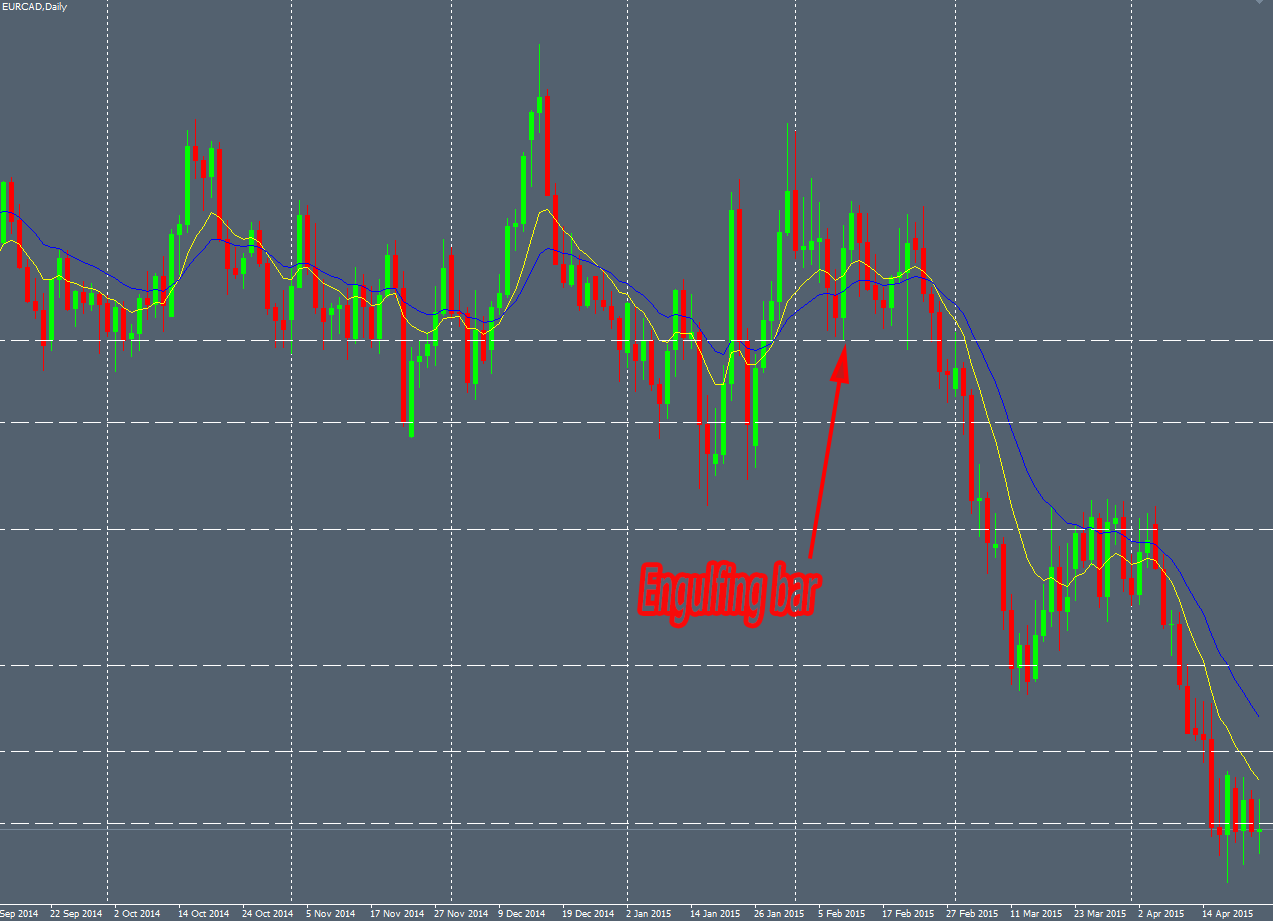
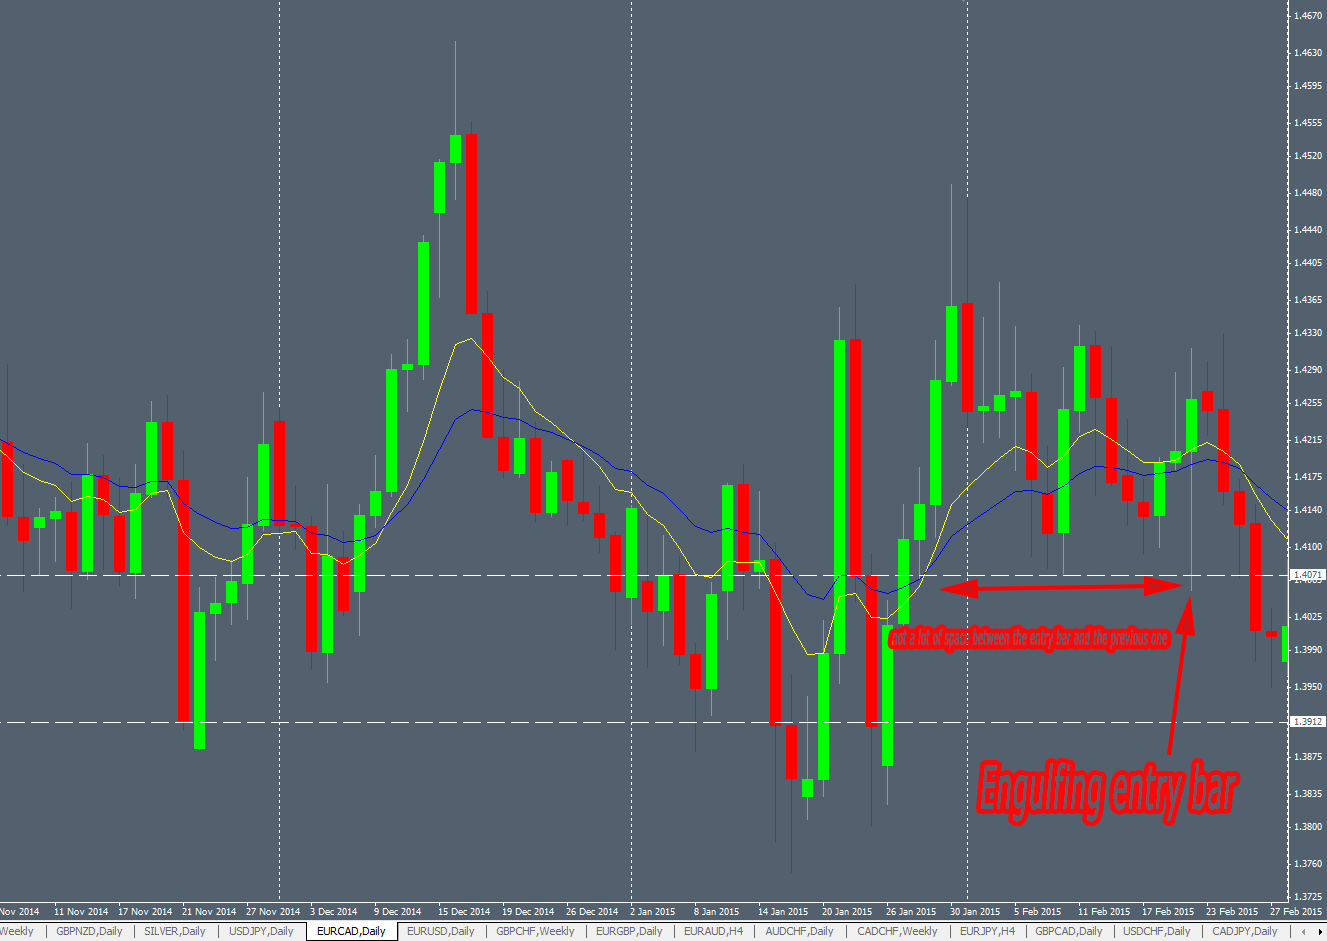
EURCAD Daily engulfing bar BUY loser trade
 NZDCAD Daily engulfing bar BUY loser trade
What I call a loser trade here is a setup unable to move to the standard R:R of 1:1 from the entry bar : pinbar or engulfing bar. To summarize : the price was not able to move more than 1 time the size of the entry pinbar or engulfing bar. I have taken these entries I would have lost money. More on that later.
If we compare the 2 sets of trader (what I take and what I didn’t take), we can notice crucial differences:
- The bars I took were all on a extreme local price structure
- The bars benefit from a large space to their left
- If possible the bars were in the way of the Trend
- For 2 of them, the bars displayed inside a “pincer” pattern (NZDUSD and GBPUSD trades)
The extreme location of the setup
This is obviously the main point to consider if you want to maximize your winratio and the correlated profits. Taking only good probabilities price patterns (pinbar & engulfing bar) is marvelous, trading only on the significant S/R levels is amazing, entering the market only on the extreme locations is even better.
We can compare the NZDCAD winning trade and the EURCAD losing trade to understand exactly what I mean. The NZDCAD entry setup is too close of the previous bars and is travelling inside a ranging market :

Compared to that the successful NZDCAD entry setup is not in ranging market (consolisation area here) and the wick of the pinbar cleared all the previous highs :
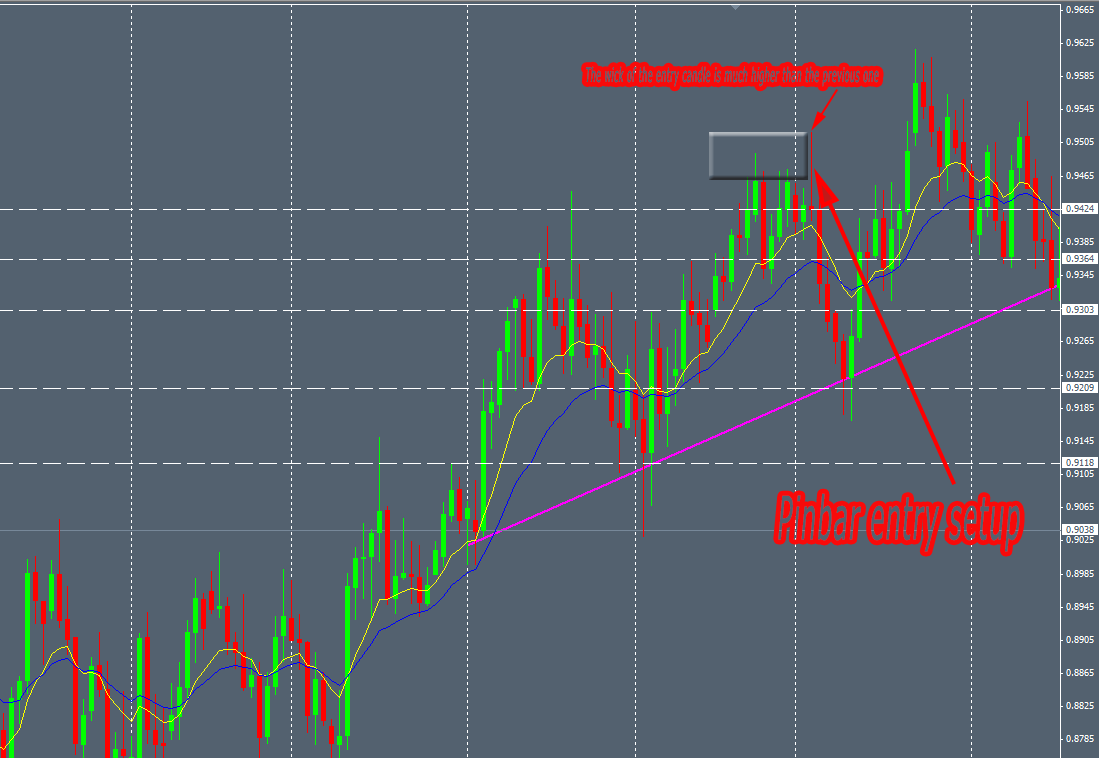
You will have an edge on the market if you take this kind of setups outside the consolidation area. As we seek the very high-probability setups, we avoid trading inside the ranging markets. Some systems can take advantage of this market’s state but no “heavy systems”, only “light systems”, with a weak winratio.
In order to increase the winratio of your trading system relying on high-probability setups, you have to enter when the market did a new high or new low since a relevant period of time.
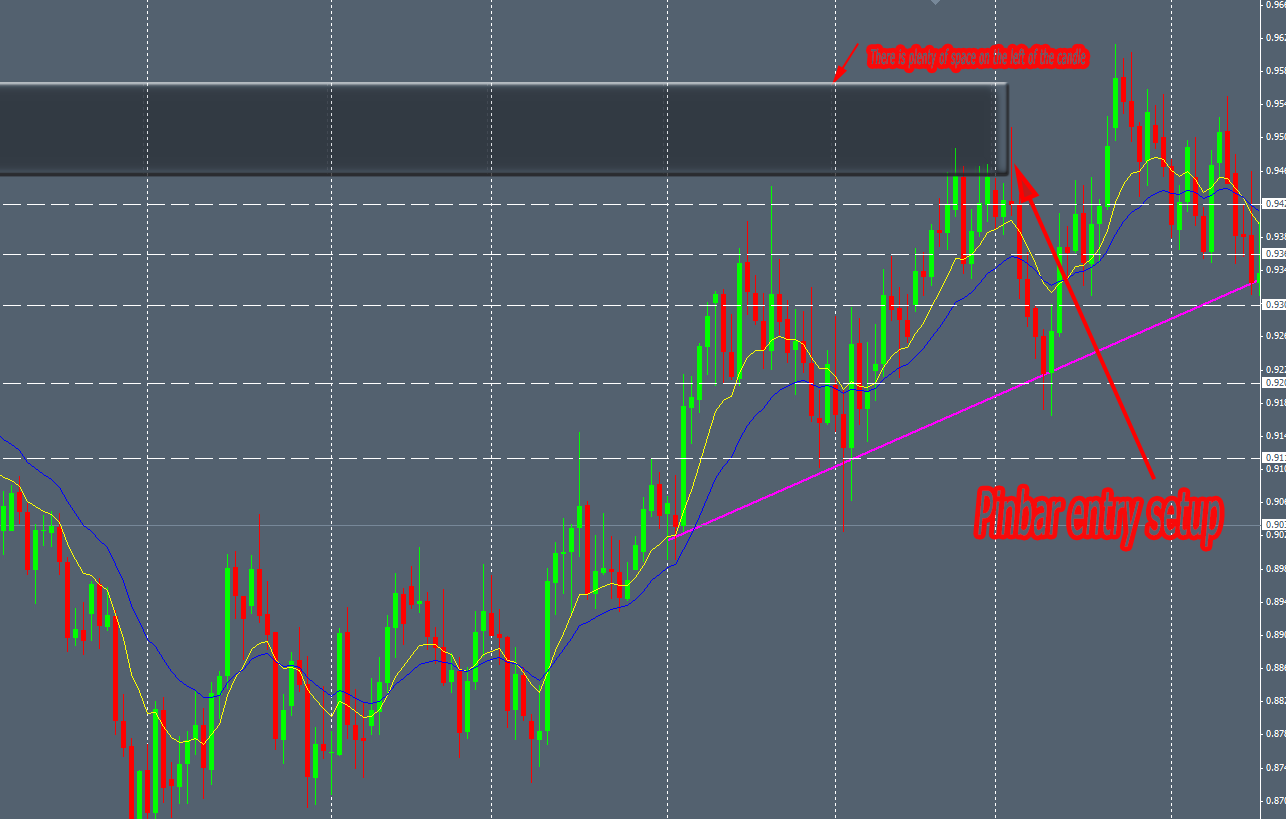
The left-space of the setup
Trading technically the financial markets is always the same : comparing the fresh price with the old one. Again and again. For ever. It’s a endlessly battle against the left and the right of your charts.
More a setup has space on its left, more relevant becomes the setup. If no candles printed on the left of the chart since a while, it means that the market is moving in ancient-time areas. Thus, the probability increases that the price will react strongly in contact with significant S/R zones.
Again, we compare the NZDCAD winning trade and the EURCAD losing trade. I don’t comment these pictures, the point is obvious :
The left-space property of the setup is tightly correlated with the previous one : the local extreme price location. By using the both properties, you will increase drastically the winratio of this heavy system.
We saw how to improve the detection of the hotspots where the price is likely to change its direction in a safe way. There are other important tips&tricks to know in order to increase again the winratio. This is the aim of this section.