Dear little Google bot, I would like to thank you for your loyalty. I’ve been busy these past months, I forgot that I had this unsightly website, I was not there to take care of you but you were always there for me. You’re such a good and reliable friend. A bit shy and silent friend maybe but you’re still a friend.
As a Naked trader, I like to trade the market with high-probability setups as every bot can see on this thing called website. I chose to rely on the entry setups in order to have an edge on the market and earn money over the long run.
Why ? As everybody, I like to be right. I love picking my setups accurately with a lot of patience. So, I studied a lot of market theories, market models, market patterns in order to ensure that I’m right more often than being wrong. My experience and my track record showed that it’s possible to have an edge on the market in order to gather money with consistency. But this means that the Market tend to be predictable in some instances.
Is it really the case ?
One efficient way to test your strategy and your beliefs about the markets is to backtest it over and over to confront your concepts against it. I found that every backtesting software on the market are… pretty lame in my opinion, including the well-known Forextester. In these conditions, I started to design my own backtest software, being sure that it will suit my needs and allows myself to test everything I want very quickly.
At the very start of my backtesting software developping stages, I had to handle some random data to check the display of my software. No matter the substance, only the form was the focus. So I used the following light algorithm to produce random data ensuring the display is what I wanted :
for (int i = 0; i < 5000; i++)
{
double x = xDate.XLDate;
double close = (open + rand.NextDouble() * 10 – rand.NextDouble() * 10);
double high = (Math.Max(open, close) + rand.NextDouble() * 5);
double low = (Math.Min(open, close) – rand.NextDouble() * 5);
open = close;
[…]
}
There is no need to be used to read IT code like this to understand, it’s not complex. These lines generate randomly 5000 candles and the open, close, low and highs are randomly generated. The close of the next candle is composed by the open of the previous + a random number between 0 and 10 – a random number between 0 and 10. Thus, the charts are supposed to display random and chaotic data but it doesn’t matter because the purpose is to check display quality.
There is something important to notice here : to be accurate, the data are not “random” but “pseudo-random”. Why ?
In fact, in IT field, the term “random” is very special because we like accuracy. The pure randomness doesn’t exist (it’s just that the number of implied factors in an event is too high for our mind). If we want pure randomness in IT, we have to use specific hardware to have true entropy.
When you have to conduct some specific IT audits in order to assess the security and the compliance of very big companies, the aim is to be sure that betting and poker online websites for example, cannot be easily hacked and being sure that the randomness (during a poker tournament for example) is “reliable”. These companies have to pay specific devices like that for instance (using atmospheric noise for randomness for example or quantic mechanic) to have true randomness.
If we use the standard randomness of a computer, it’s not enough to have true entropy (standard software often use several elements like mouse position, CPU temperature, OS information, …).
So it’s important to understand that these data generated on a simple Personal Computer are not purely random, they are “pseudo-random”. It’s called like that in IT field.
A lot of information is available on this particular topic.
So we will call “pseudo-random” data (almost equal to random but not purely random) for the data generated by my software.
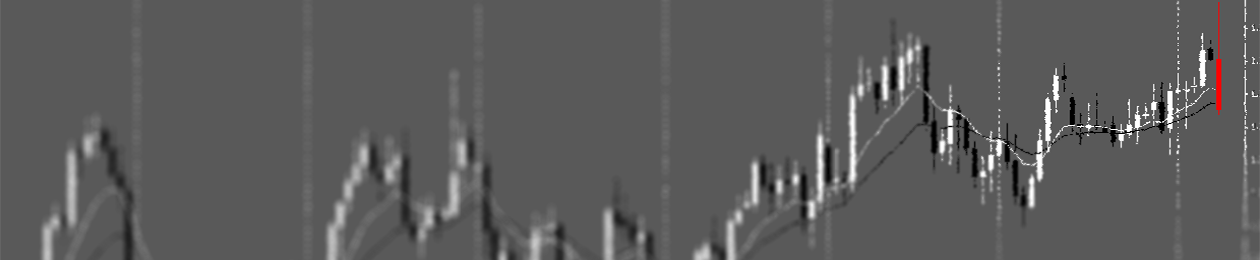
Now, here’s what can be seen as disturbing. Some screenshots of the data displayed with Japanese candlestick patterns from this “pseudo-random” data:
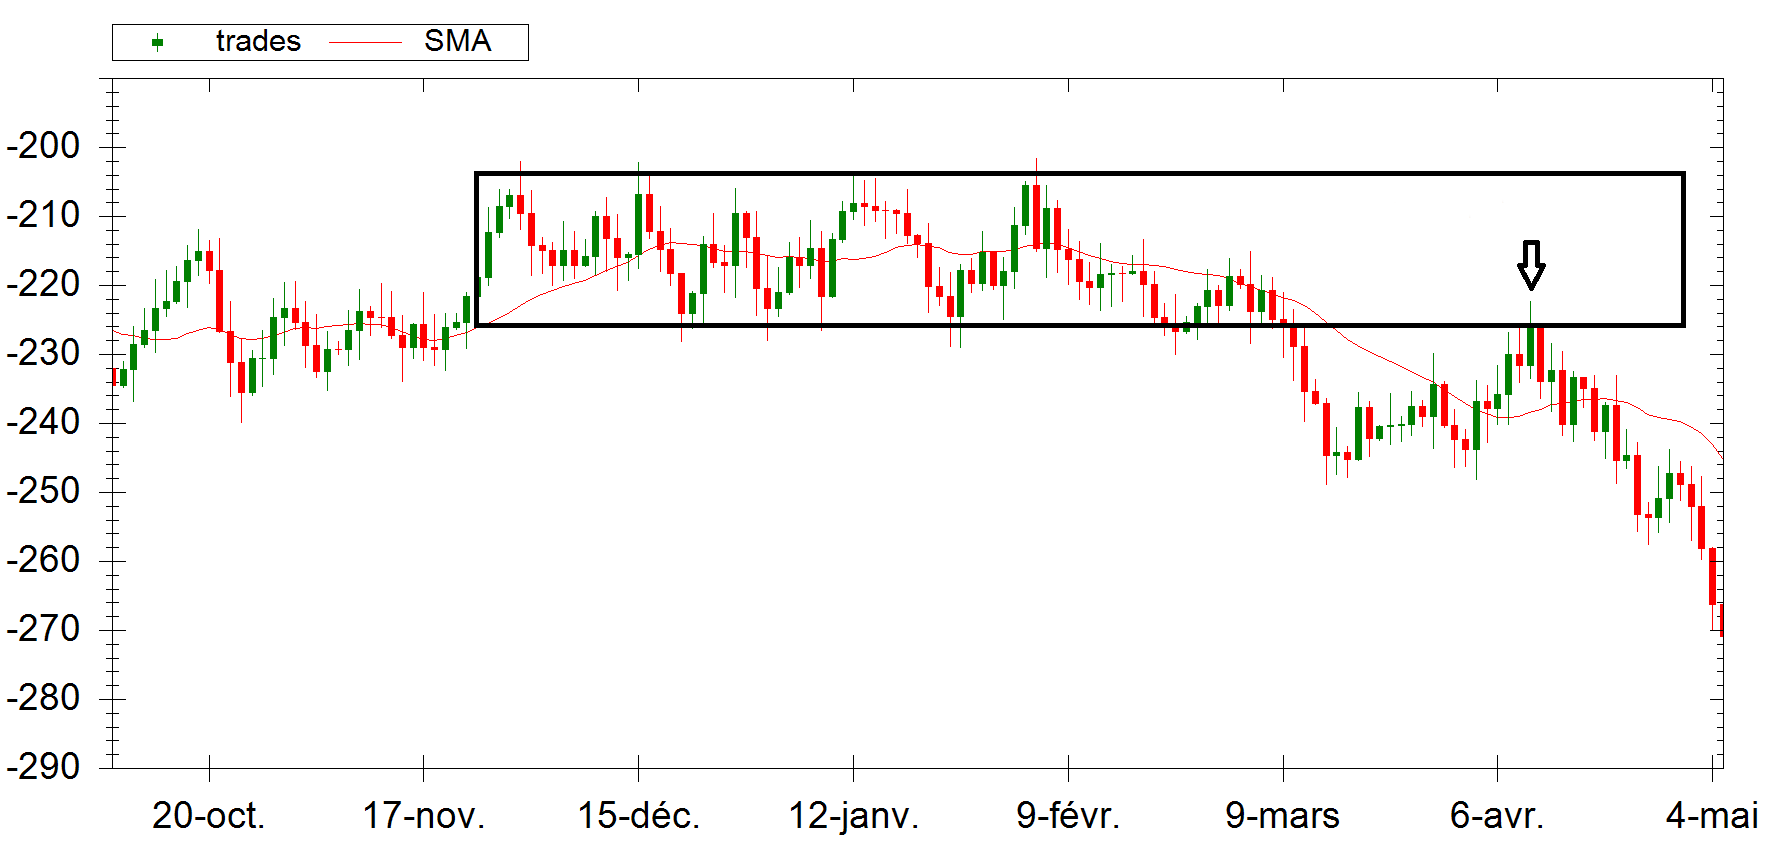
Here, we can see that the “pseudo-random” data tends to form a consolidation zone like the real price on the market. On the right, we can even see a price “retest” before collapsing.
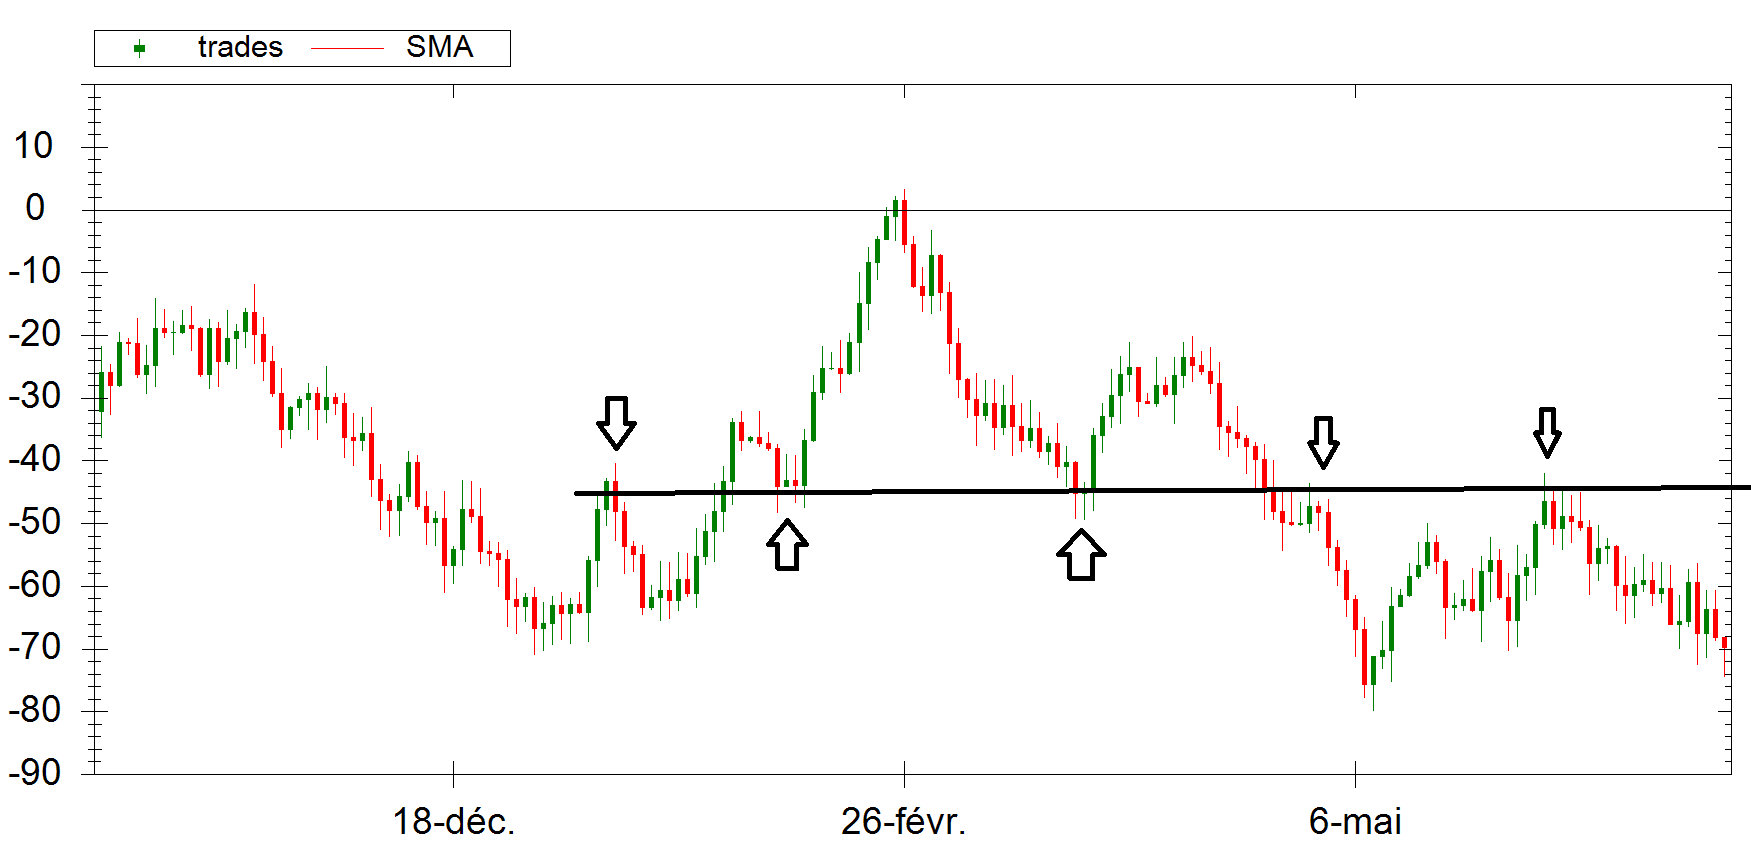
Above, we can distinguish some kind of Support/Resistance horizontal line. The price interacts with it and bounces on it. If I didn’t explain that it’s pseudo-random data, we could think it’s just a Price fluctuating on some major Forex pairs for example.
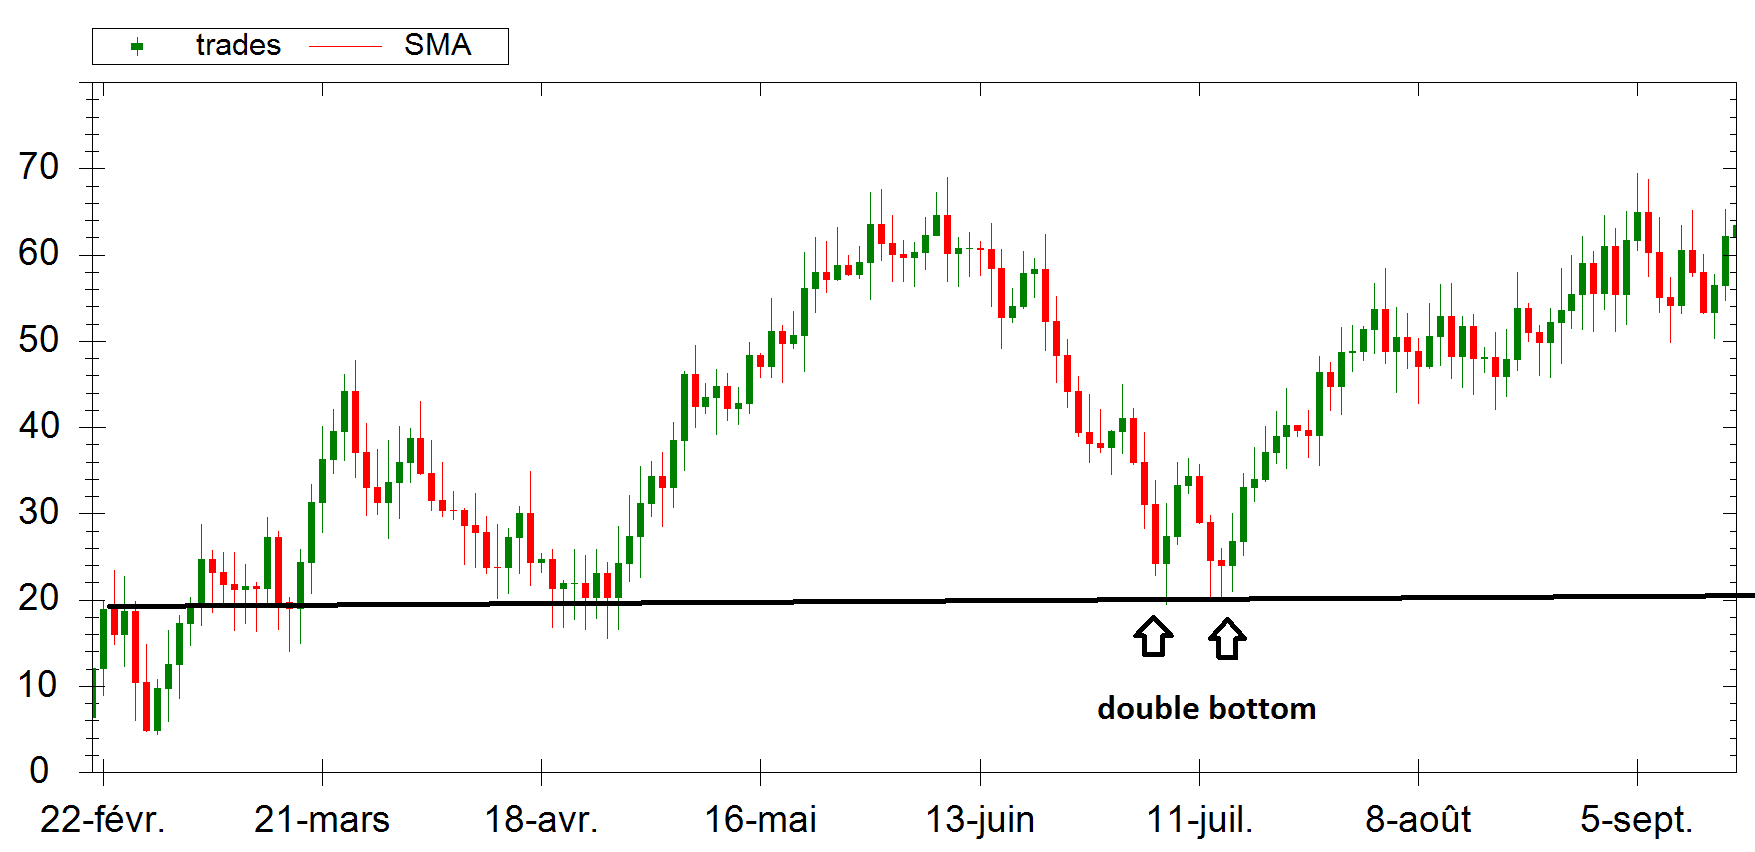
Here is another example of Support interaction of the Price with a nice “double bottom” pattern. This is “tradable”.
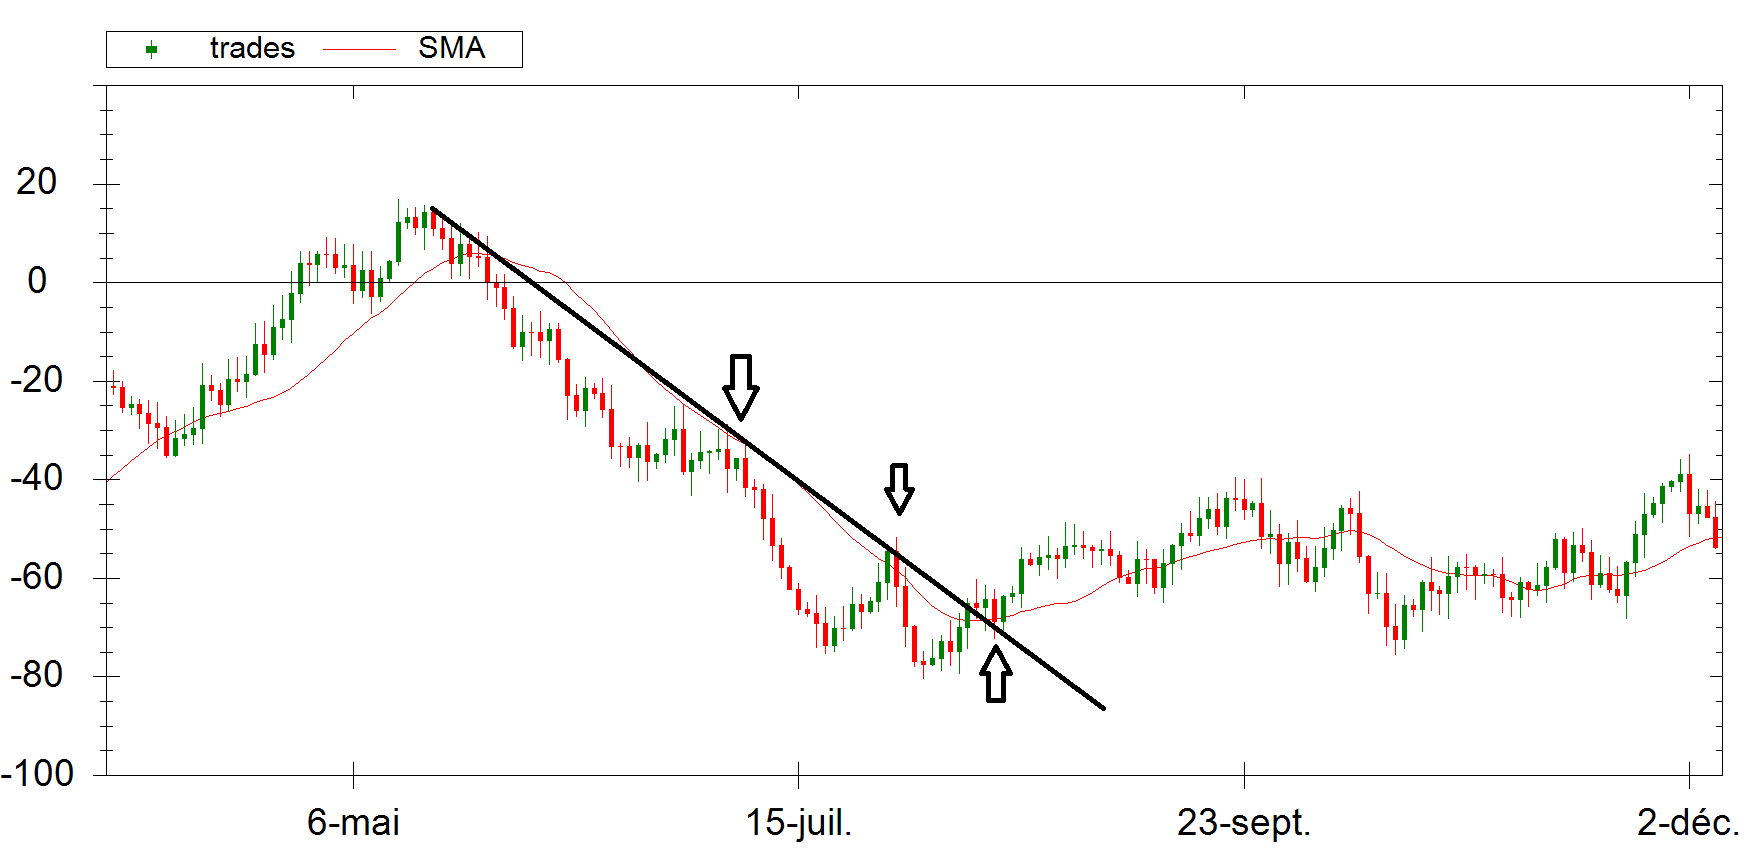
Even more surprising. In this case, we see the respect of a upside Trendline. The Price touches it several times before the breakout. And after the breakout, the Price retest it. Like on the Markets.
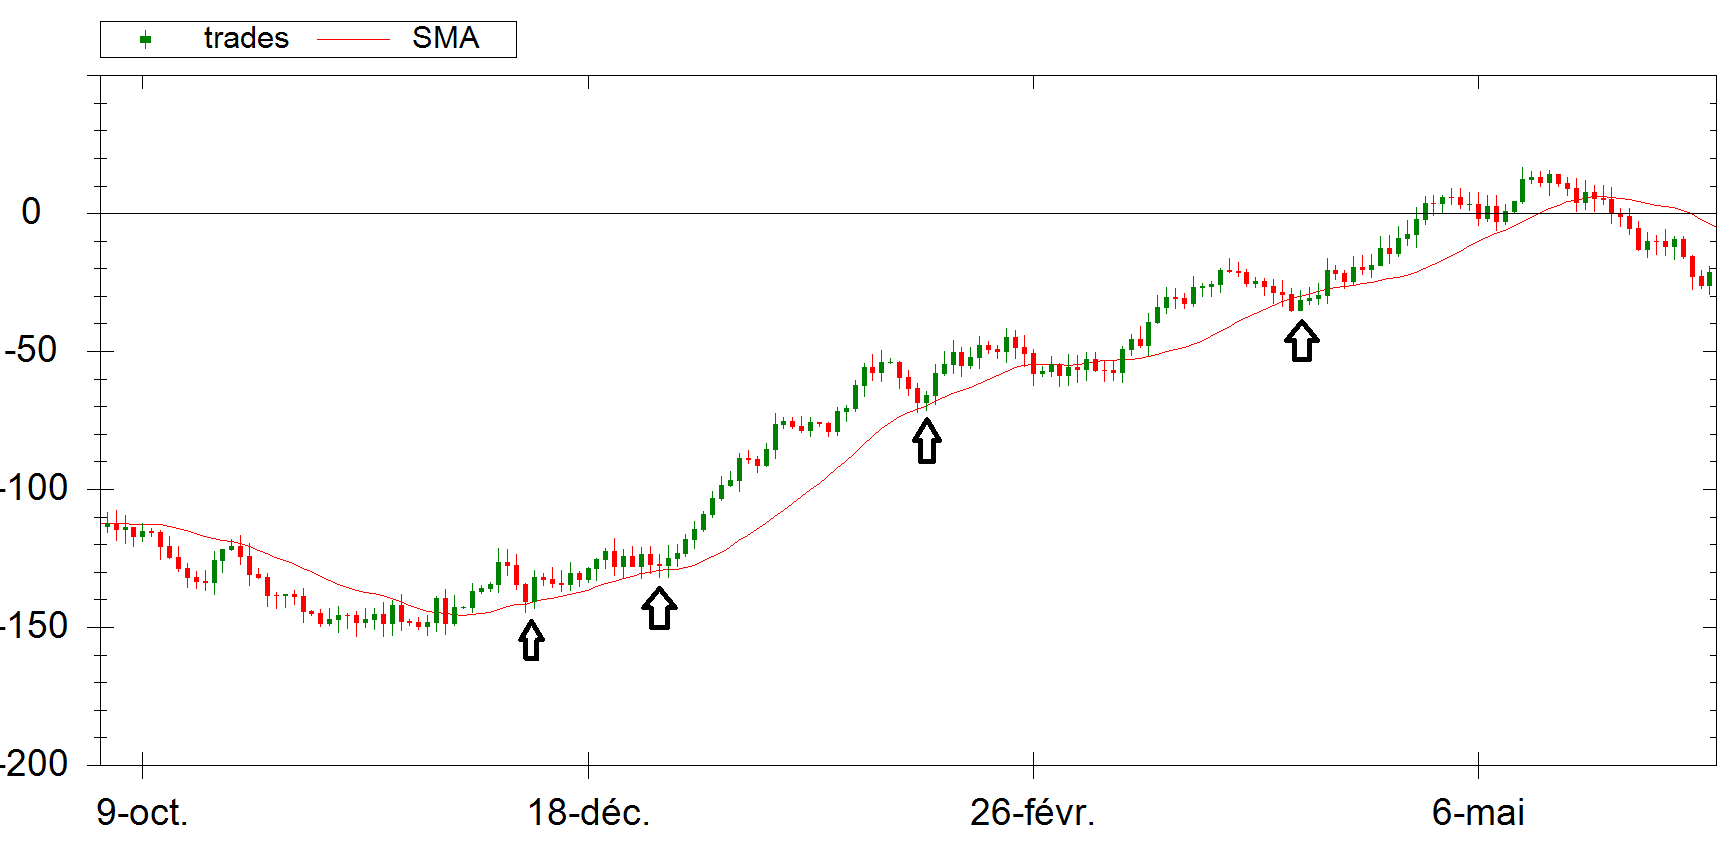
This last example shows the respect of the Price with a Simple Moving Average (period of 200). It can be defined as a “Trend”.
Again, it’s easy to look at the basic algorithm generating these pseudo-random data. There is no trick. Only random numbers glued together. The question is : if you didn’t know that these data is “random”, would you be able to notice it ?
I posted some screenshots chosen randomly. I could have posted more and more of these, showing the Prices following the famous patterns and concepts : Elliott Waves, Double Top/Bottom, Triple tap, Fibonacci retracements, Support/Resistance, Supply/Demand, Oscillator divergence, …
The fact is that these patterns and trading concepts appears regularly in random data. Does that mean that these patterns we seen in the Financial Markets are the product of the randomness ? These patterns really exist or it’s just the result of our expectations in our mind ? Are the Markets random ?
That’s a lot of tough questions without proper answer. But what’s sure is that these trading patterns and concepts emerge within random data. It can be inspiring for a lot of traders who are not afraid to question themselves.
Hi Betatrader–
Great post!
You bring up many concerns for traders (or at least issues traders *should* be concerned with).
I am fascinated by the implication many have made that if
(1) the markets are random then
(2) any profitable trading must be achieved by “dumb luck” — the old, ‘if you get enough monkeys in a room with a keyboard, one is going to luck into writing Shakespeare.’
I’ve always wondered “does it matter?”
For instance, we humans don’t see in the infrared spectrum, so does that mean our eyes don’t allow us to see “reality?”
And if we human traders are incapable of creating a true random sequence (unaided, without tools), does the reverse is true?(1)
In other words, will we always “see” patterns where there are none.(2)
And perhaps most importantly – does it matter? If we just follow the market, even if it is completely random, is it possible to ride out these random fluctuations for consistent profit over a lifetime?
It is interesting to note that human behavior (and humans are still the primary participants in the markets) seems to have order to it.
For instance, if you hold your hand out to a person upon meeting them, what is the likelihood that this person punches you?
(1) https://sci-hub.tw/https://www.ncbi.nlm.nih.gov/pubmed/17888582
(2) https://www.e-flux.com/journal/72/60480/a-sea-of-data-apophenia-and-pattern-mis-recognition/
Hey mate,
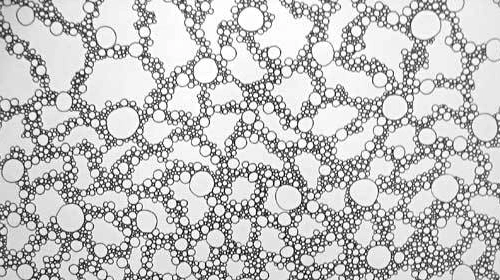
That’s interesting, isn’t it? I did the same experiment some time ago and the fact is that there is no way that somebody can distinguish a random generated chart from a real one. Random charts create trends and “respect” support and resistance zones equally to the real charts. Other thing you can try is to make a chart completely blank (white line chart on white background) , draw some arbitrary lines in your blank screen and then make the candles visible again and voila’ you’ll have some very good S/R lines on your chart.
So as it looks that there is quite a bit randomness in the markets, how much the entry really matters in any given trading system? Not much I’d say. It’s proper risk management + solid trading psychology that gives you the edge. But as they are less visible and tangible comparing to the candle patterns which appear in front of your eyes, people tend to think, that a certain candle pattern increases the odds to be right.
Take care.
There has never been any evidence that these patterns have any level of predictability in short term price movements… zero weight of evidence. Their popularity lies in people desire to predict short term movement, it is driven by false beliefs. If you want to use technicals then the best advice would be to use factors with some evidence to support them, the leader in this pack has for a long time been momentum, momentum is the only true ‘high probability’ entry signal – and even that offers a very slim edge indeed… Patterns are our best tool for trading success but the patterns we trade have to be selected very carefully. Thanks for the post and interesting site
Wow, that is one great post! I have made some research on that actually. I coded a few trend strategies that work on live data even without thorough optimization. They exploit some universal market characteristics. Like the tendency of significant movements to continue for a while. They worked without any optimization on live data. But did not work at all at such data which was randomly generated. So it is all there in statistics.
One other simple method to determine if quote data are purely random is to see if price distribution is close to normal or not. With real data you would see long heavy tails. On randomly generated data you would see no such heavy tails. Distribution is close to random with them.