The capacity of seeing what the others won’t is a serious edge in life and in the markets.
Here is the AUDCAD H4 live chart. It’s displayed from the FX Pro Metatrader 4. The close time is N-Y Close. Do you see something interesting on it ?
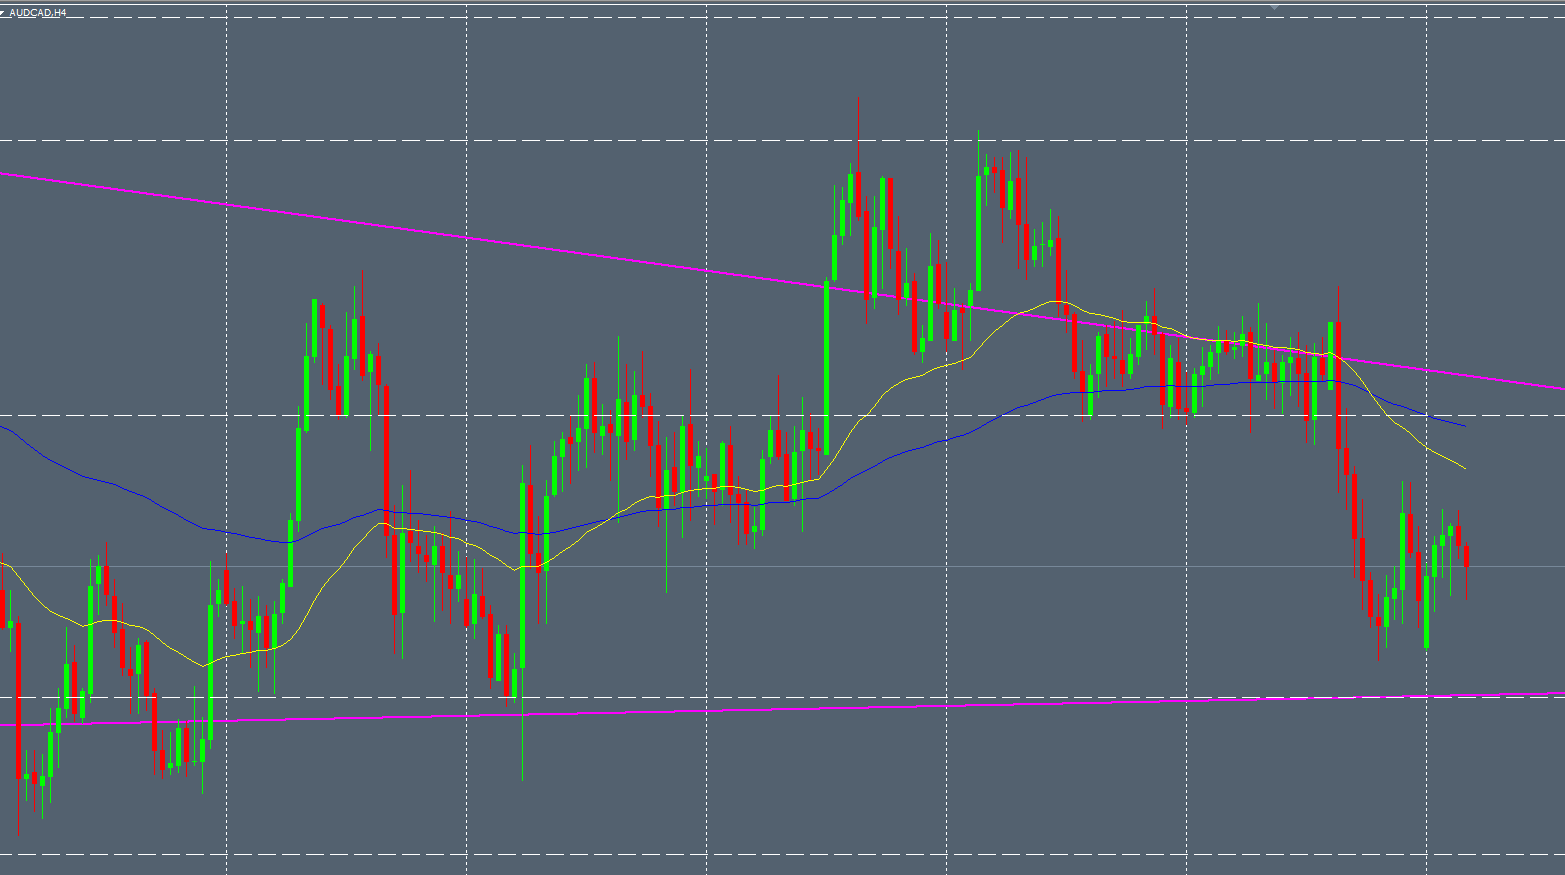
In real life, when we want to sense an object properly, we take it, we touch it and we rotate it to see the top, the bottom, the sides, … Now, let’s try seeing the exact same chart with a different point of view.
Now I take my AUDCAD H4 live chart, from my Oanda Metatrader 4. The close time is midnight EST :
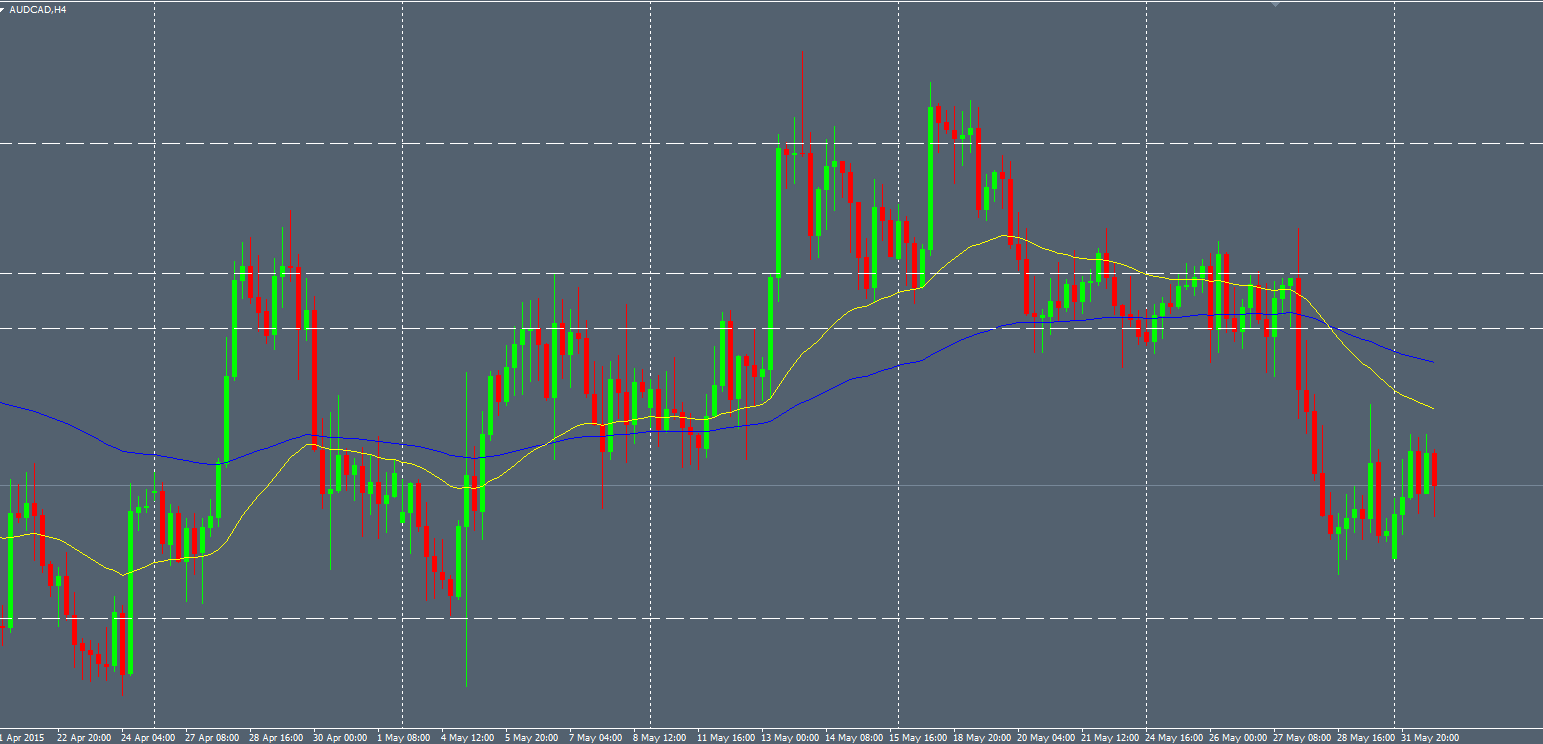
Do you see something interesting now ?
Still not ?
And now :
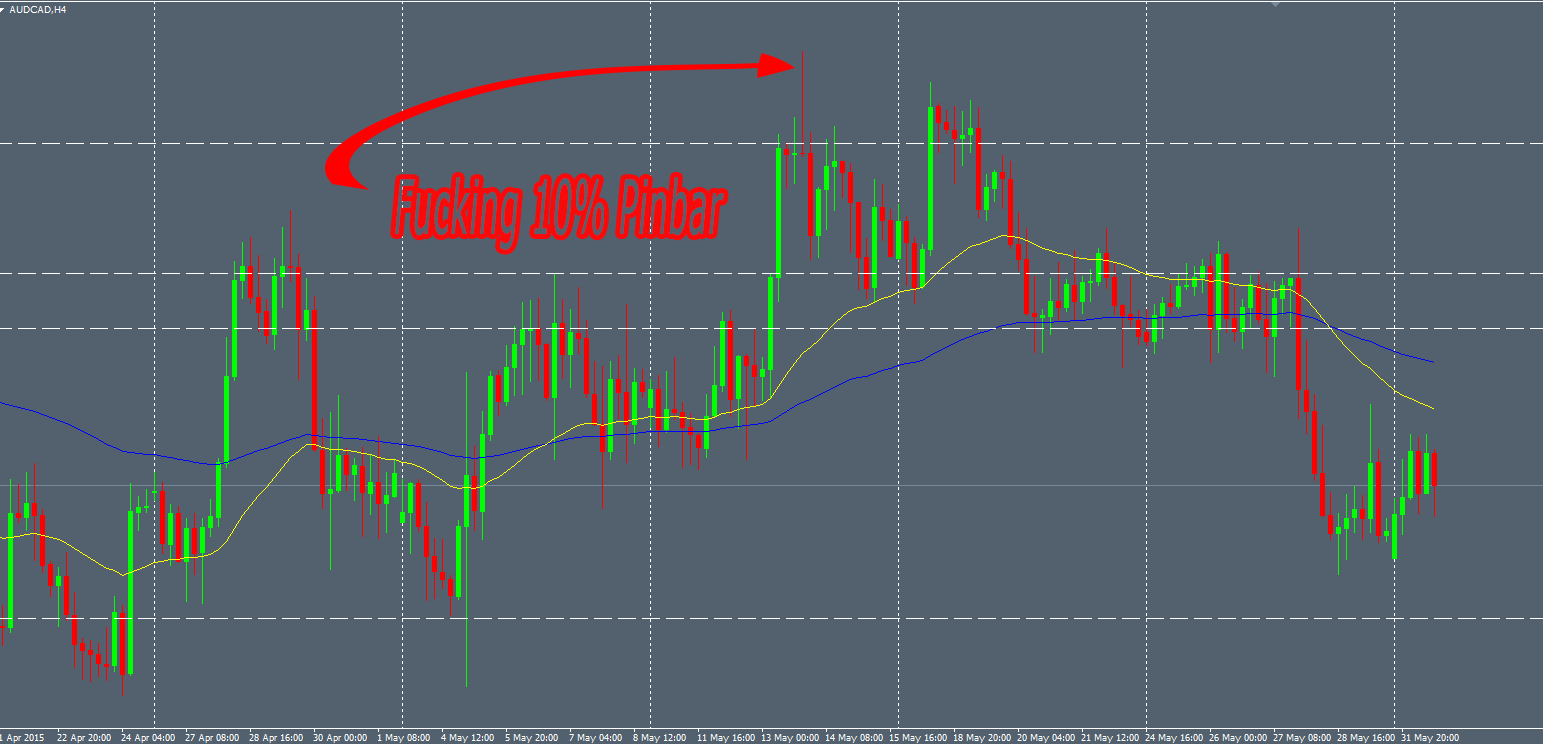
A heavy high-probability price pattern magically printed on this chart. This is a 10% pinbar. A strong high-probability pattern that you can take almost everywhere on the chart. Luckily, this pattern printed on a significant S/R level. This is why the price reversed and collapse after that.
Easy trade.
Obviously, I took it and I made money with it (visible on myfxbook)
A lot of traders only look at the charts based on the NY Close daily time. It’s a mistake. The price is everywhere. If you want to see the markets in different point of views to perceive them better, try other close times. You’ll be surprised to see a lot more opportunities…
I have heard about you a lot on Walter Peter’s site, finally followed a link
I like your approach and writing style
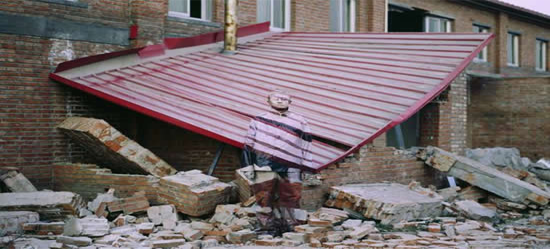
haha …. I am like that man in the picture, invisible to most people unless they look