That’s good to see reliable price patterns on the Markets charts when you zoom in but it’s even better when you can deduce the presence of price “structures” when you zoom out. Stepping back from the charts is often efficient and allows you to see the overall picture about the Price context.
Just taking unwisely the Engulfing bar and Pinbar Price patterns everywhere on your charts will help the Markets to suck out your money very quickly from your wallet. When we see this kind of pattern, we have to notice the overall picture of the Price Action to answer this simple question : what is the state of the Market ?
Taking in account the Market context allows the trader to ask himself if the Price is ranging, if it’s trending, if it has awkward behavior, if it has nice and fluent behavior, if it’s likely to pop, to drop, …
With time, experience and backtesting, I categorized some states of the Market I like because it’s offering very good probabilities to make money on it. I call these “structures”. It’s not like a Price pattern, composed by only 1, 2 or 3 candles. It’s more like a larger set of candles giving the overall picture. We have to consider more the Price movements and hotspots to notice these structures. It’s not a systematic criteria and relies much more on the discretional analysis of the trader. No robot is able to see them easily. These structures can be more or less accurate depending on the Price context. The goal is to take the best ones.
“Slide” Structure
The first structure is defined by several criteria :
- A significant and clean trendline
- A significant horizontal level
- The Price breaks this trendline
- The Price retests this same trendline with a nice price pattern
- The level has a confluence with significant Fibo ratios (not mandatory but it’s often the case)
Then, when all these criteria has been checked, you can use a nice price pattern, like an Engulfing bar for example, as a catalyst to enter the Market with proper Entry, Stoploss and Takeprofit levels.
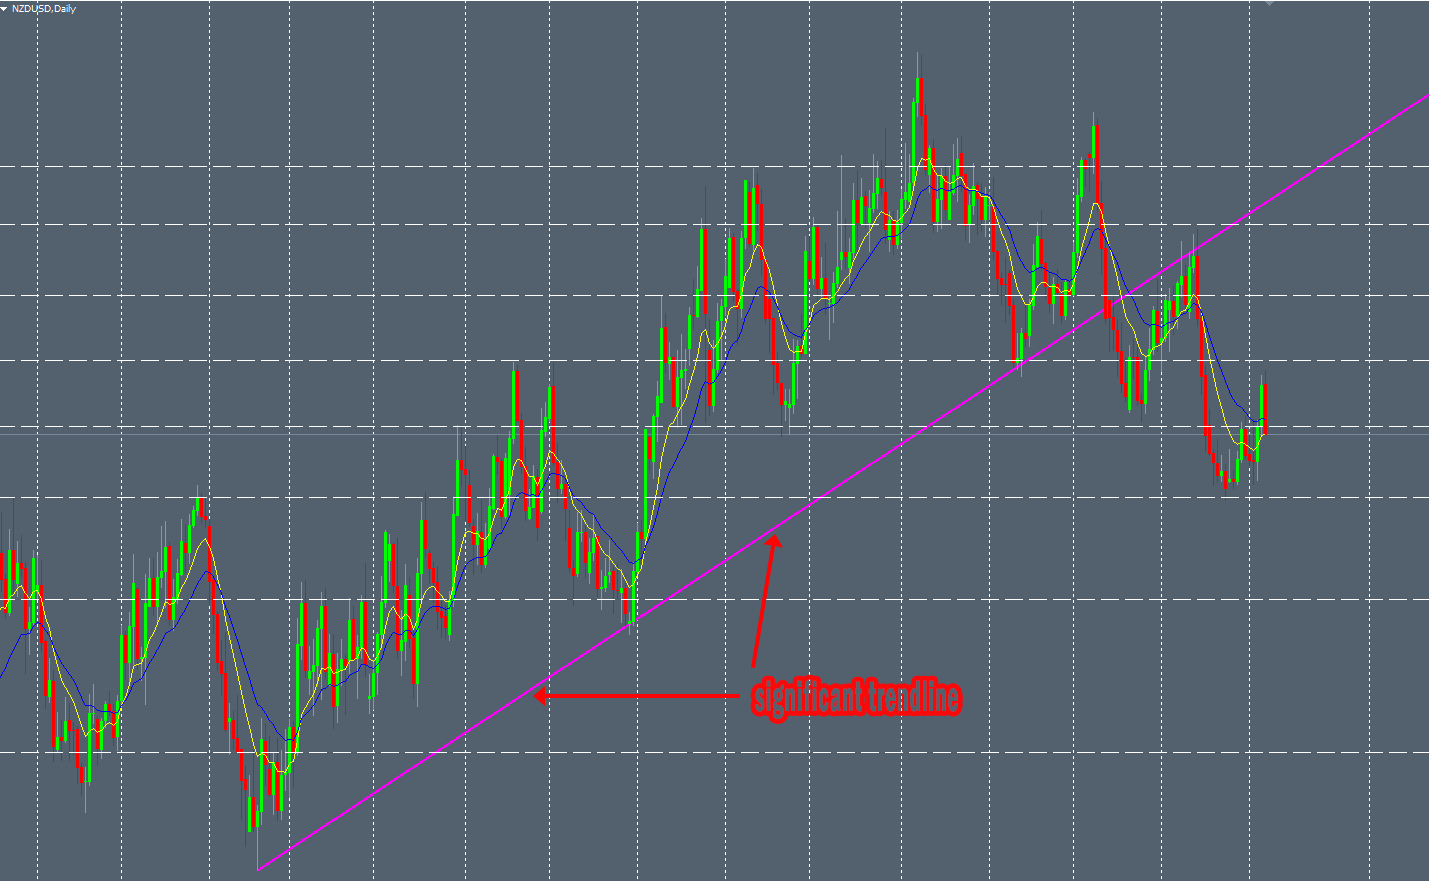
The Daily NZDUSD chart printed a perfect textbook “Slide” structure 2 months ago. I was not able to take it because the Price was in a hurry to drop and I was still in a AUDUSD trade. We can see here, the nice and efficient trendline:
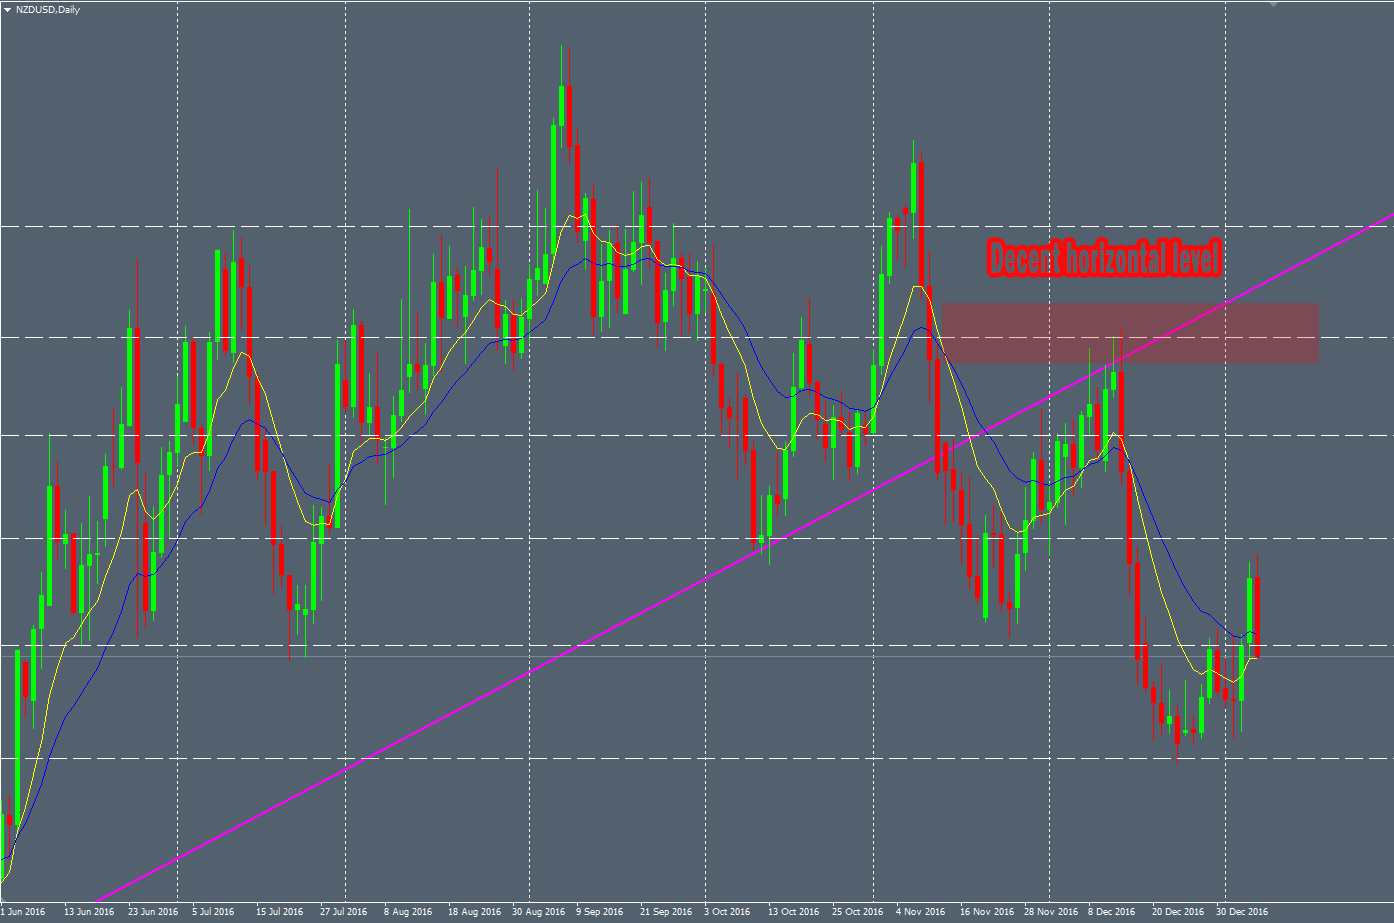
The significant horizontal levels (the price interacted with this level in the past) :
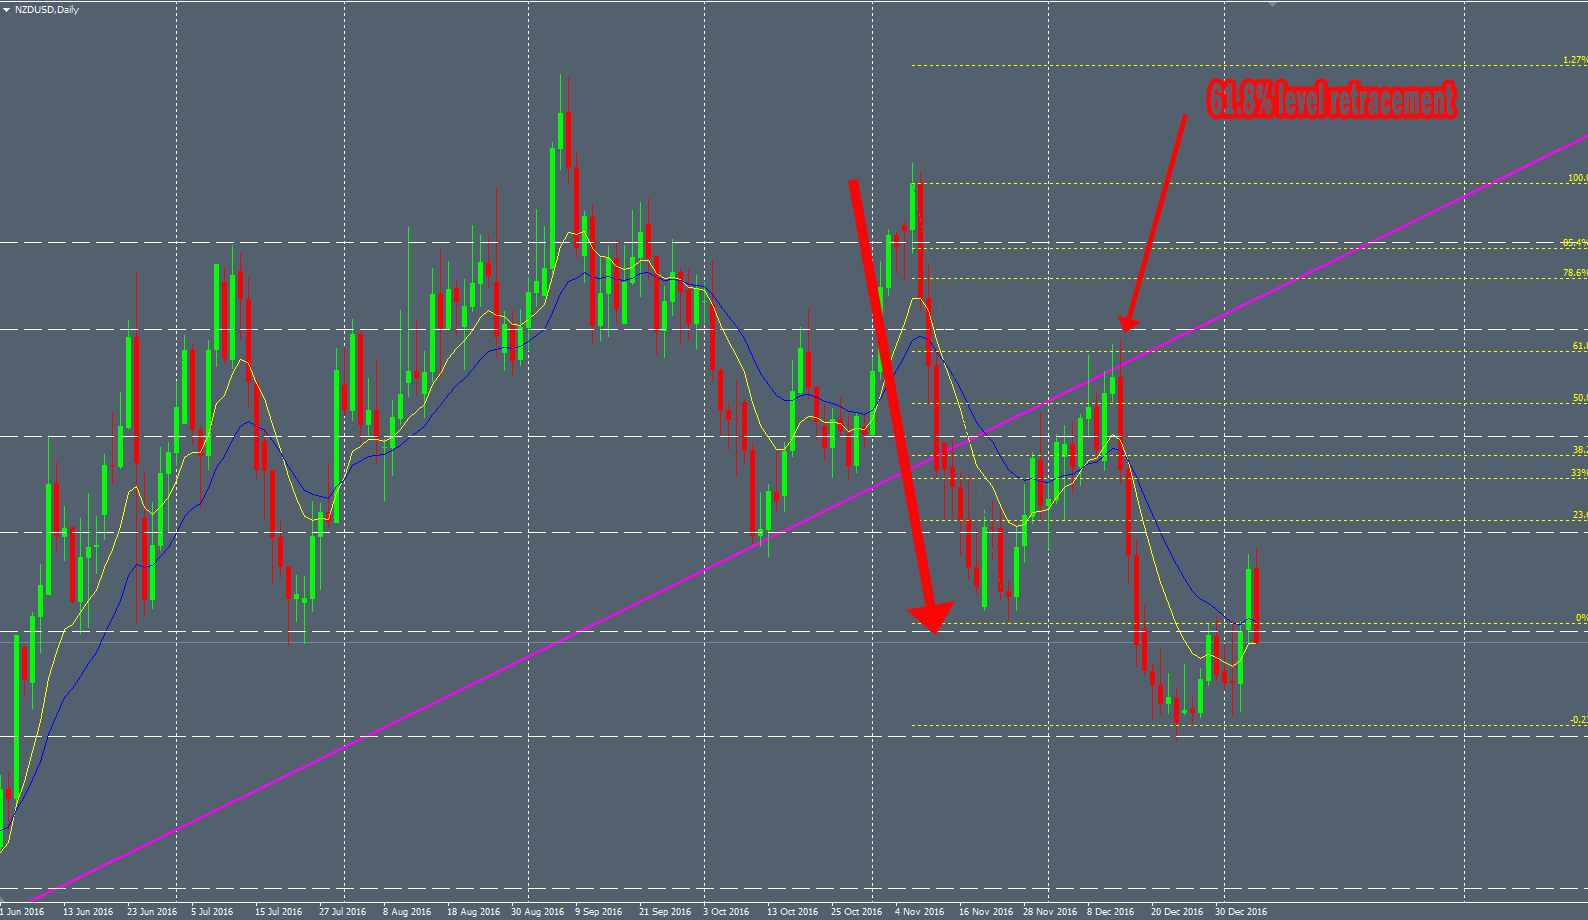
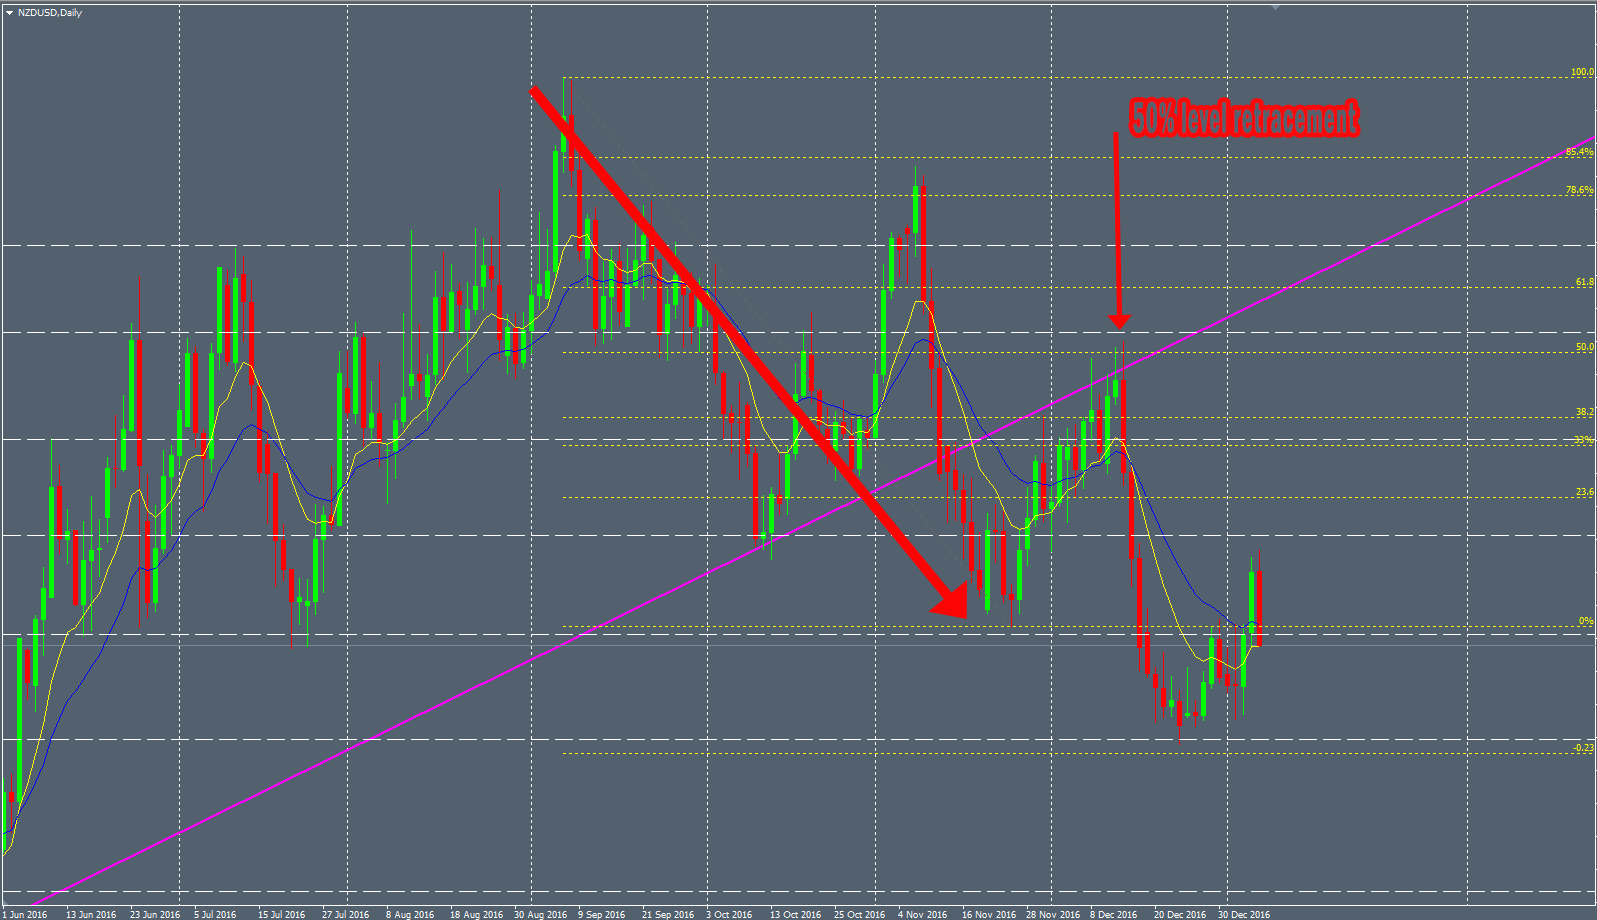
The Fibo ratios showing the high confluence of this spot :
And the lovely Price pattern as a perfect bearish Engulfing bar :
This kind of structure delivers very good winratio over the time. But the drawback is that it does not print very often on the charts of course.
“Pinch” Structure
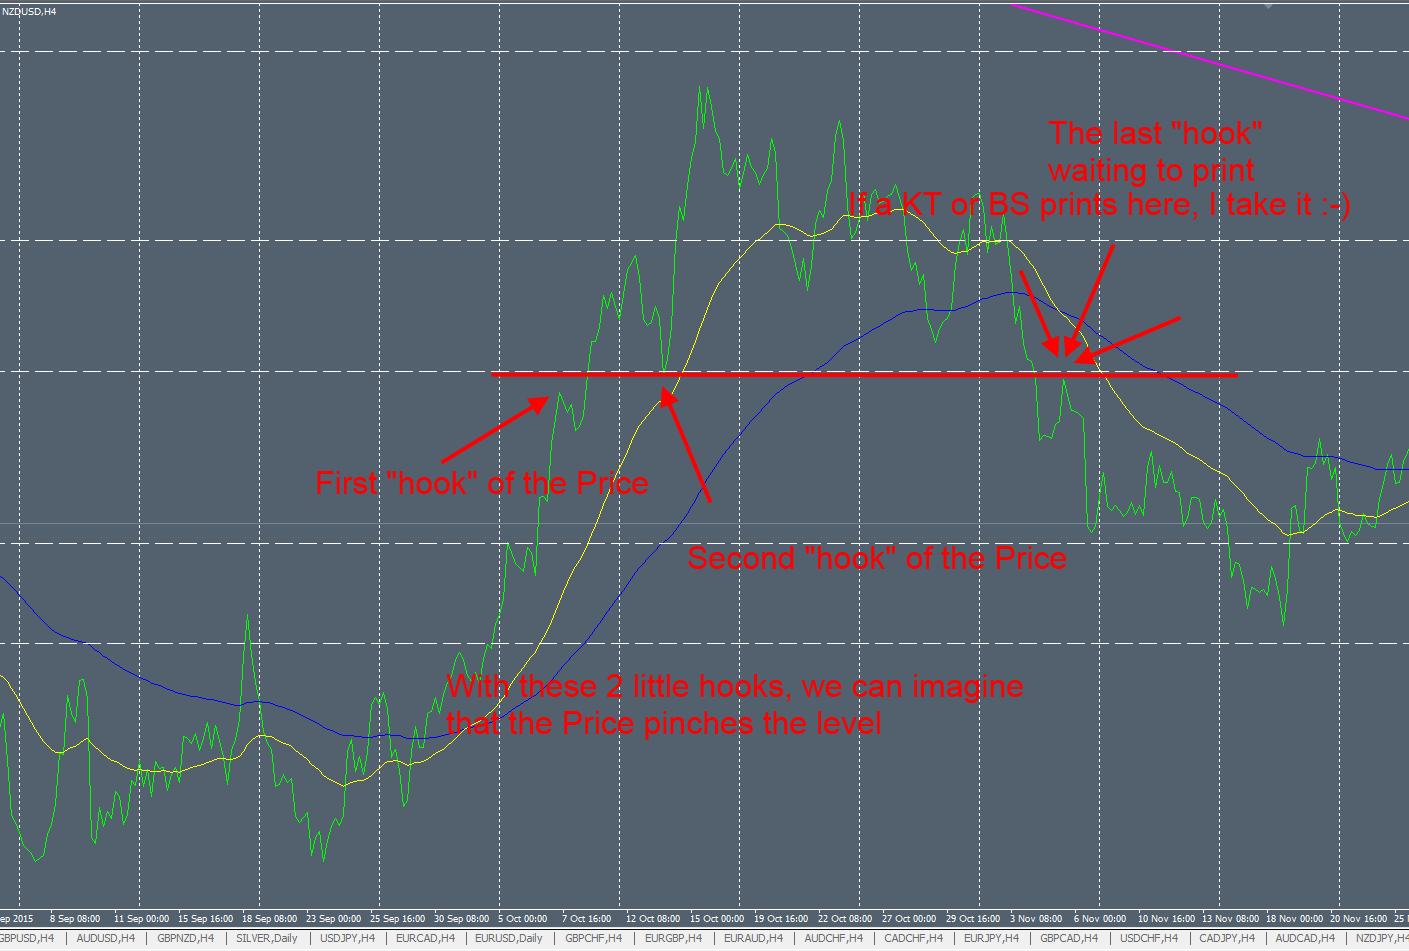
This other structure is pretty interesting and needs more discretional analysis. This a retest of a significant horizontal level in a specific Price context. To identify this kind of horizontal level, you have to analyze before the interaction with the Price on it to see a “Pinch” of the Price.
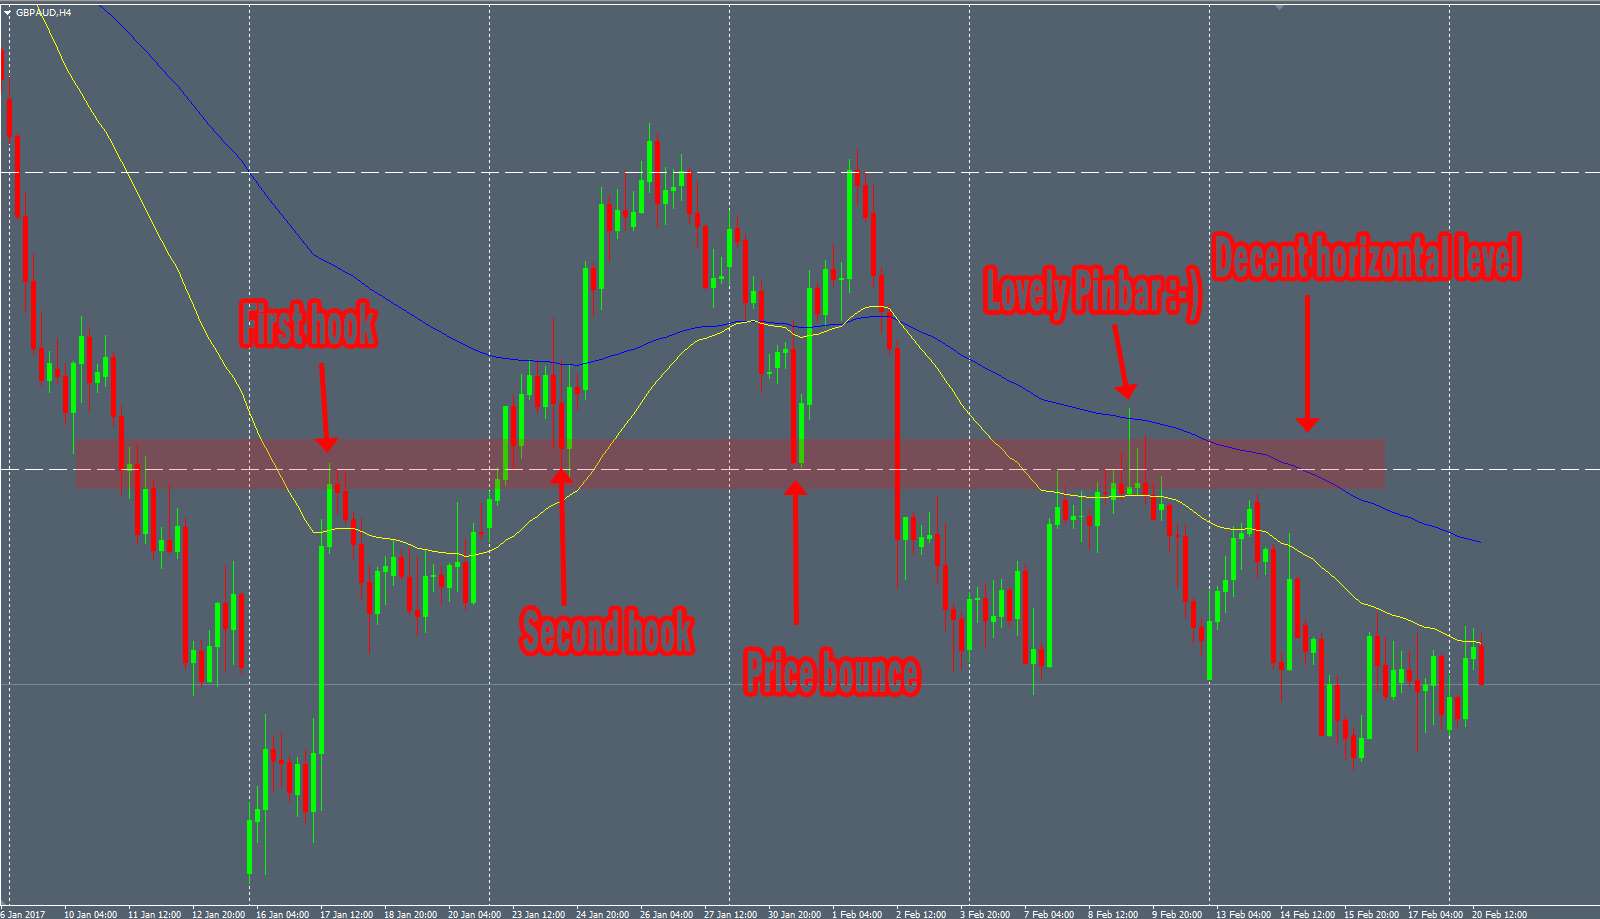
On the following picture, in line mode to see it clearly, we can see that the Price printed some “hooks” to confirm this level. After that, the Price bounced on it and once it broke, when can wait for a bearish sign and nice Price pattern as usual :
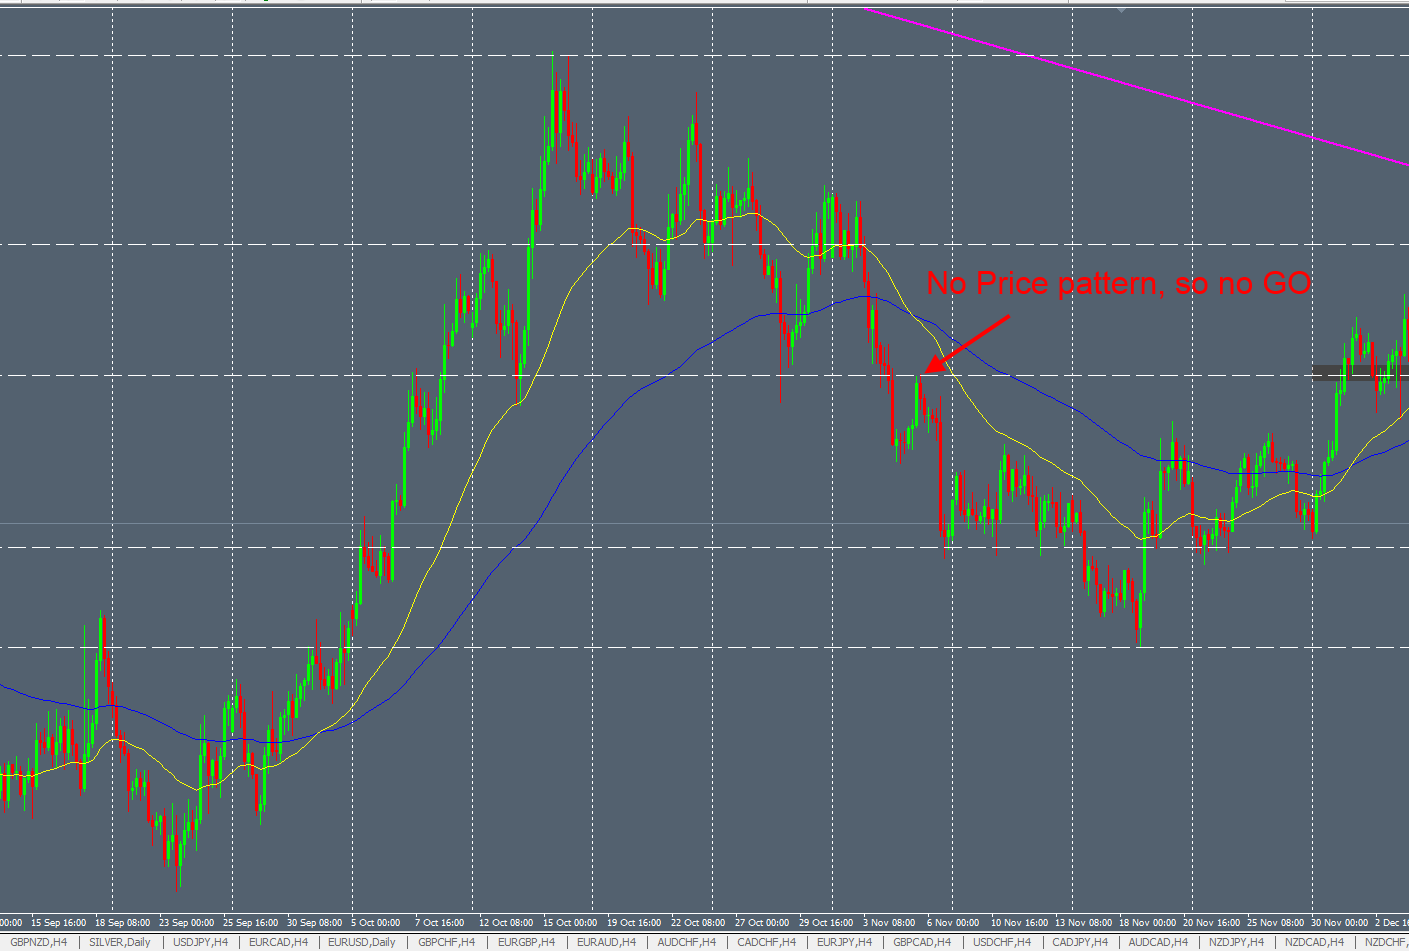
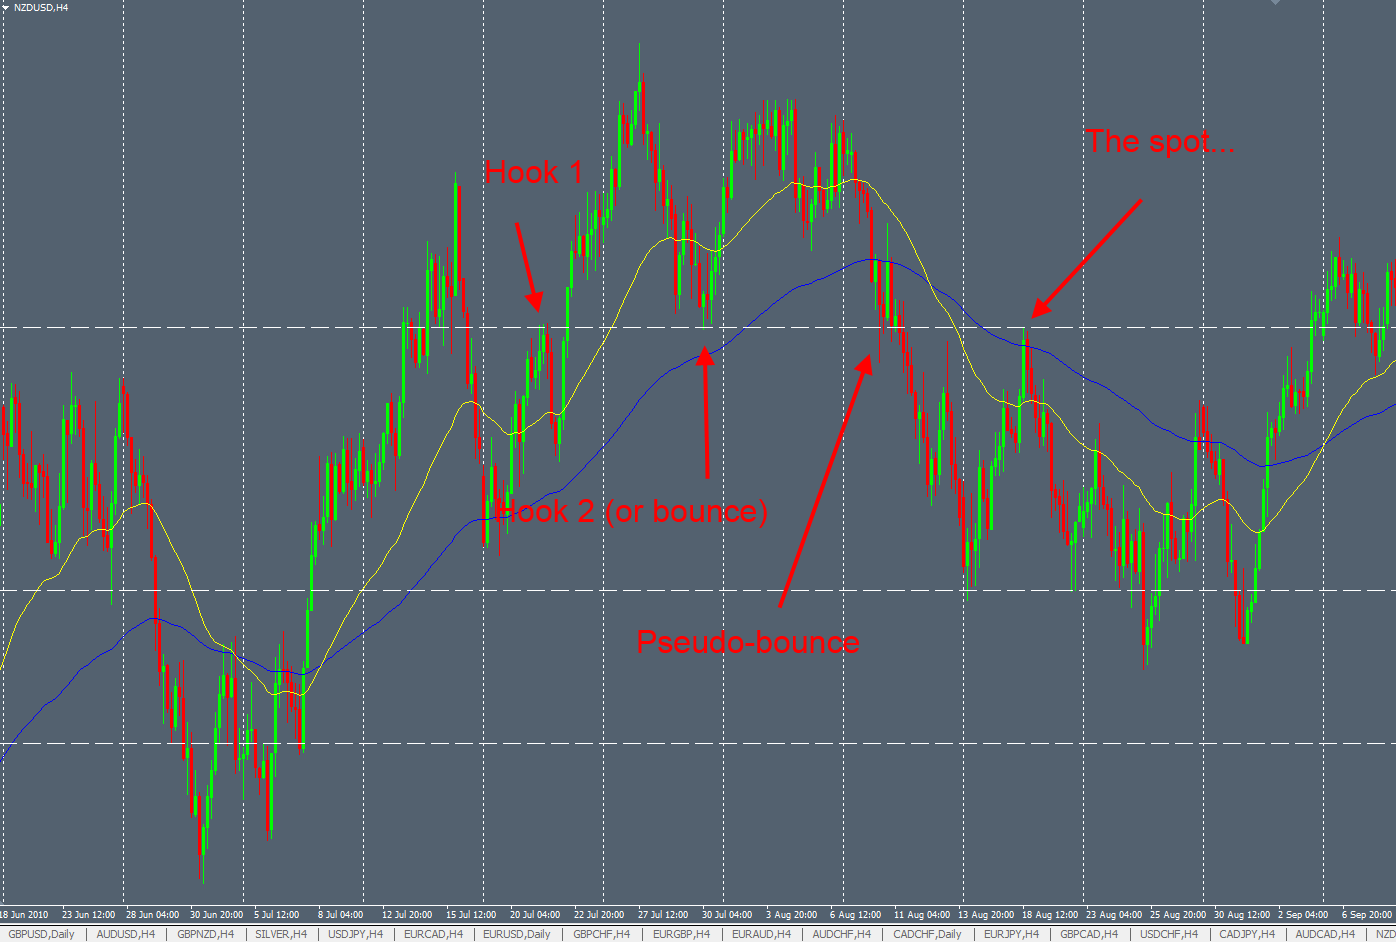
Some random examples to illustrate because it needs a bit of habit to notice them easily :
When the Price broke this horizontal level, we will look for a bearish Price pattern once the Price touches it :
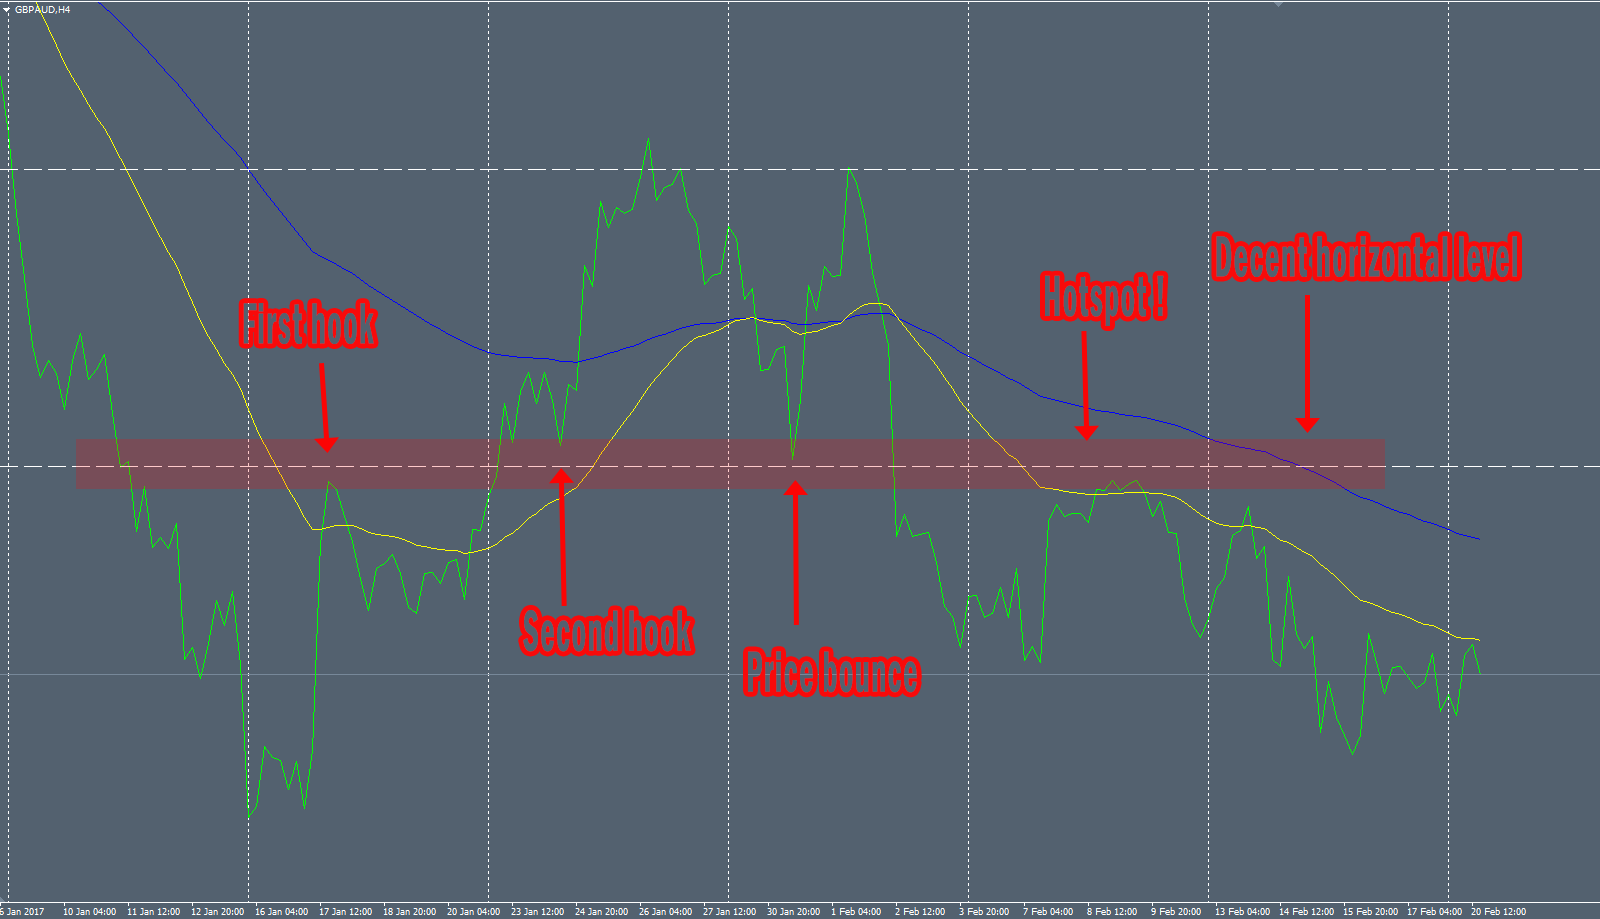
To be more concrete, I took a trade 2 weeks ago on the GBPAUD H4 chart with a lovely Pinbar within a very nice “Pinch” structure. Here is the chart in line mode to see clearly the spots :
And this great bearish Pinbar on the H4 chart offering a very good trade opportunity :
“Triple tap” Structure
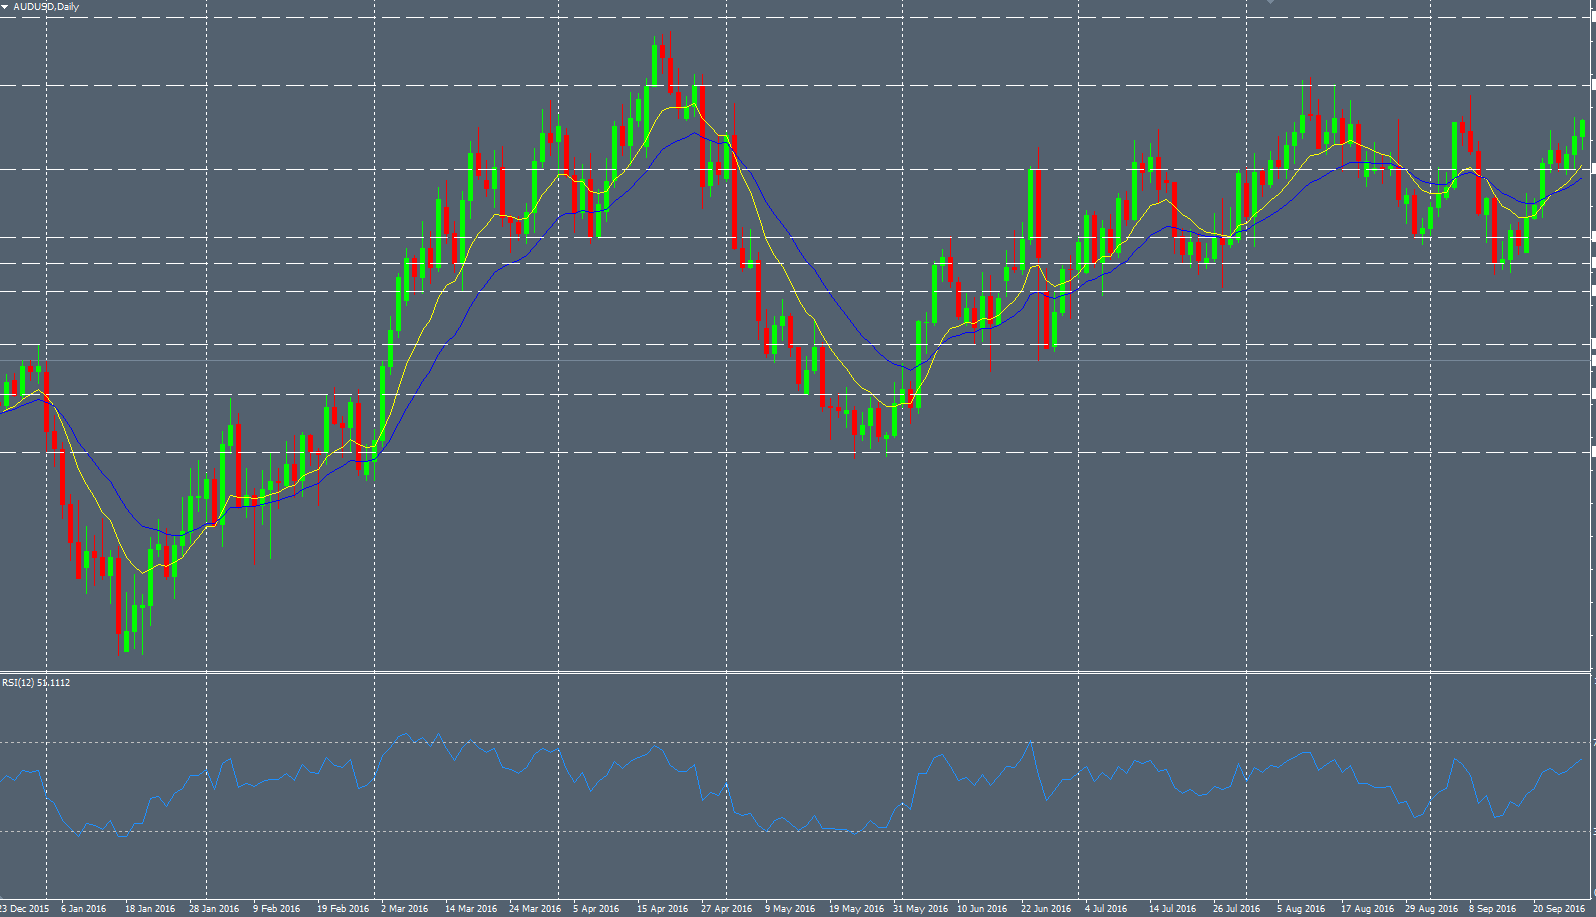
A triple tap structure is composed by 3 legs of higher highs (or 3 lower lows in a bullish setup). The reliable “Triple tap” structures are more rare and can be used with a oscillator indicator (like RSI or Macd for example) to notice divergence between the both. Here is an example on the AUDUSD with the divergence :
“Consolidation retest” Structure
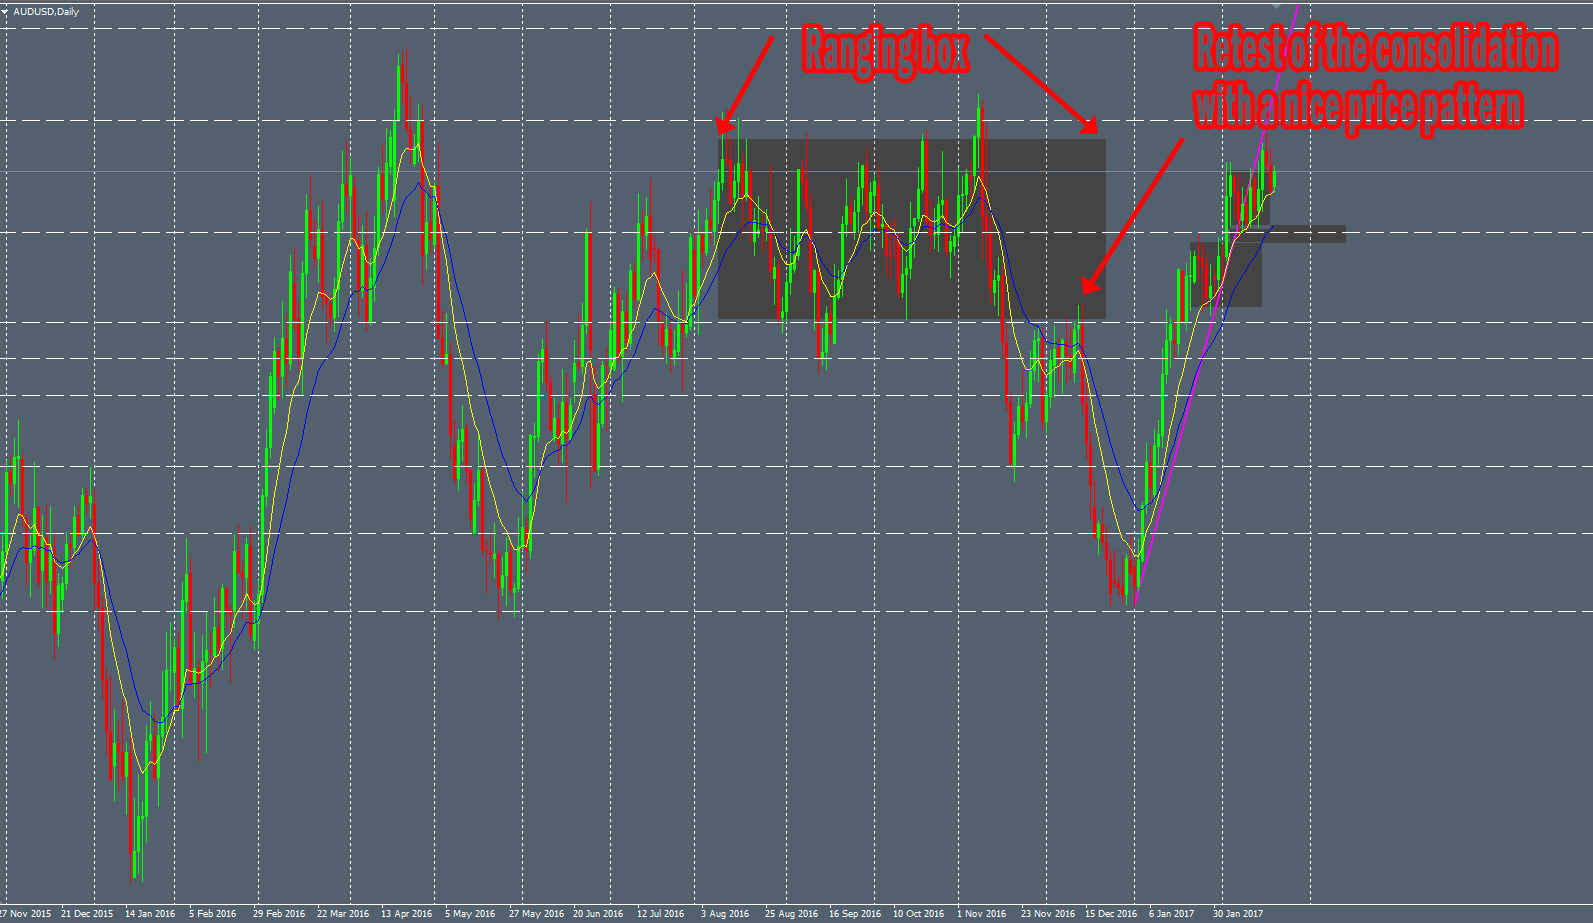
This one is pretty easy to detect when you see ranging Markets. Every Price moves follow some basic rules as the impulsive move, retracement move and consolidation move. A Price can’t move into one direction without having a rest, time to time. This rest is called consolidation (or ranging Market) when the Price goes in a specific range. In this period of time, you can easily draw “boxes” to frame the Price like we can see below:
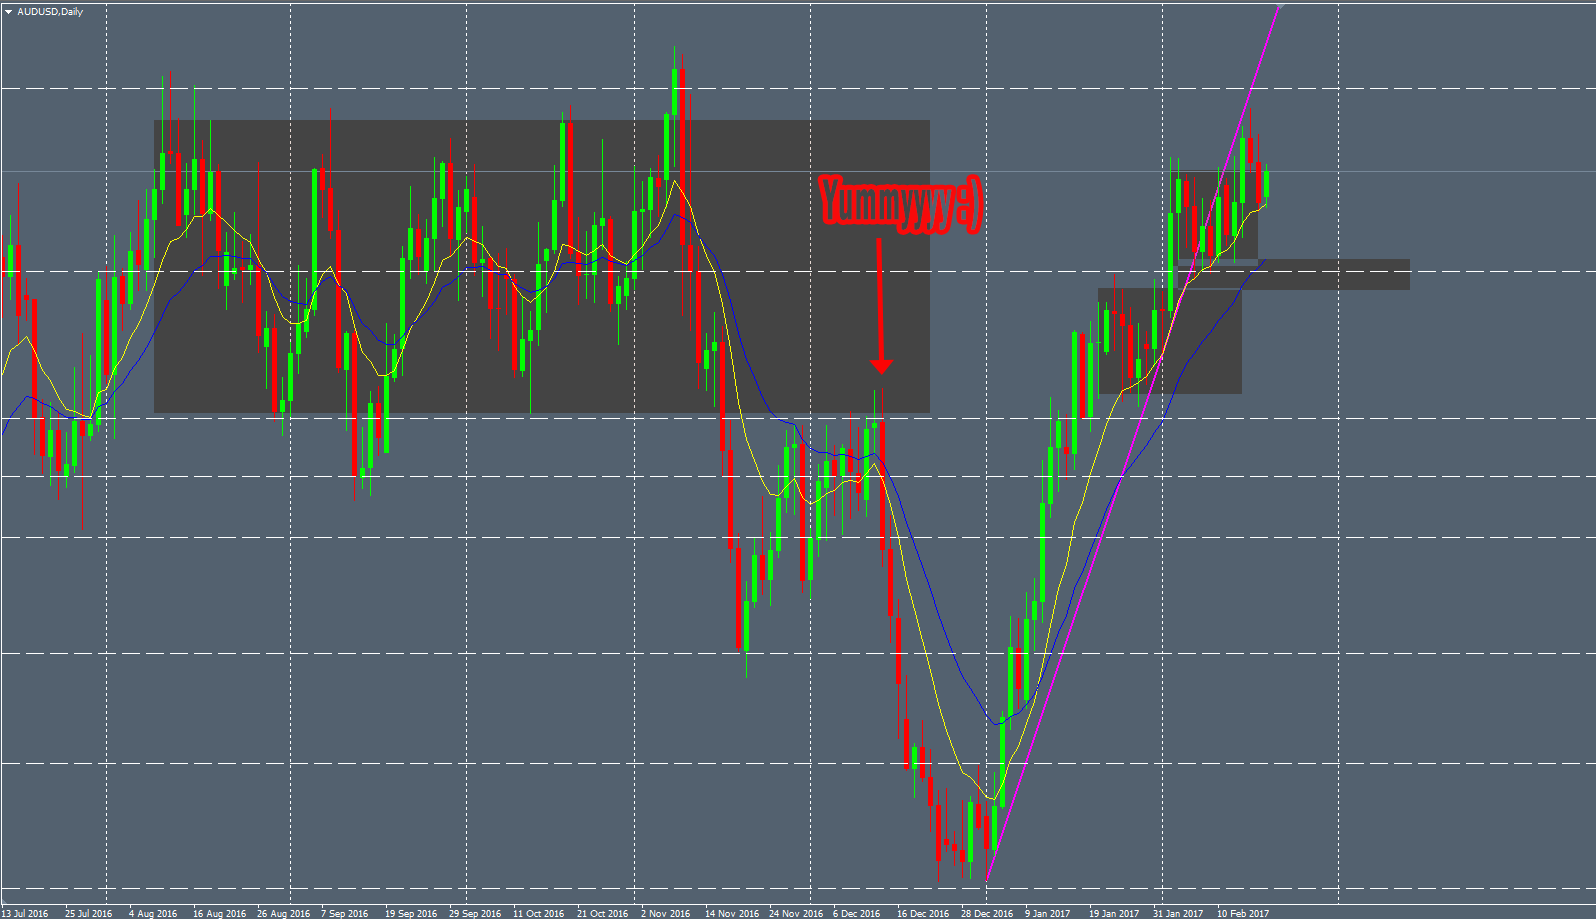
After that, you have to wait for the Price to break this consolidation “box”. Once the Price broke it above or below, you can seek for retest of the box with a nice price patter. This is what happened with my AUDUSD Daily lovely Engulfing bar last year:
The consolidation can be more or less obvious to see. If the consolidation area is not very clean and clear, it’s better to avoid it.
Others structures…
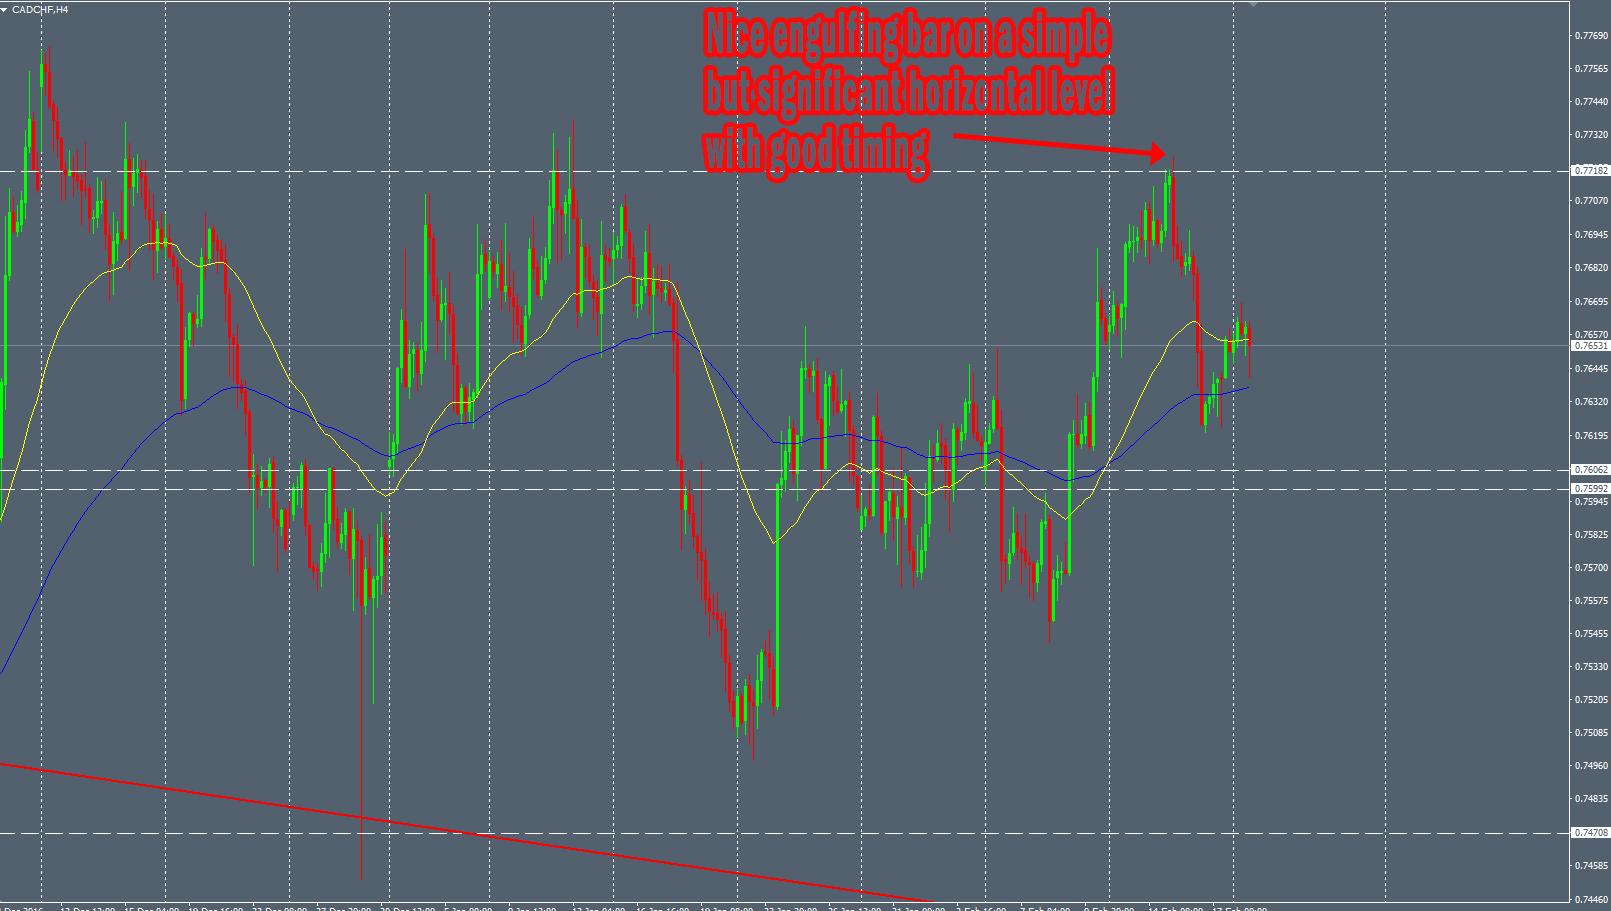
The previous Price contexts are my favorite ones. However, sometimes you can see very good Price Pattern in more standard structures. For example, I took a trade last week on the GBPAUD H4 chart on a significant horizontal level. The Price Pattern was very nice to see and the timing (the middle of the week) was almost perfect :
We can see other classical structures, like “Double Top”, “Double Bottoms” or “Head&Shoulders”. Finding a reliable Price Pattern within these efficient Price structures can be rewarding too. Add a salt of timing idea and you can obtain good probabilities on your trade.
To summarize : If you trade the Price Action without taking in account its context, you can have hard times. It’s always important to have an overall picture of the Price by zooming out and stepping back from your charts. This is where the discretional analysis of the trader comes into play.



Great article. Packed full of information – thanks for the effort.
I was waiting for this for about a year. Thank you.
Awesome article and yourself you are great. Even if you are scarse on twitter i seem to pe poking you all in vain have a lovely month and my the pips be with you as usual. Keep friends closer.
Hi Kevin,
I hope you’re doing well. If you want to chat a bit it’s easier for me by email than by Twitter :p
That… Was… Awesome!!!
Your trading articles are probably the best there are in the internet. Competent explanation with real trading examples and profitable real history for over 2 years now. And every time you give a chance to see the market through the eyes of an experienced trader. There are no such great articles anywhere else, that’s for sure. It’s a shame your blog is not at all popular, it deserves much more.
Nice Website, Nice to keep reminding me to keep it simple and to know that using a couple of candle patterns you can be profitable. Please keep updating the site.
Dude awesome post! A bit hard to see the charts though with the screenshots you used with the backgrounds. But some killer patterns nonetheless!